

Question: 1. Consider the following regression analysis output: Table 3 Simple Linear Regression Analysis Output a. What is the sample size? b. Write out the regression
1. Consider the following regression analysis output: Table 3
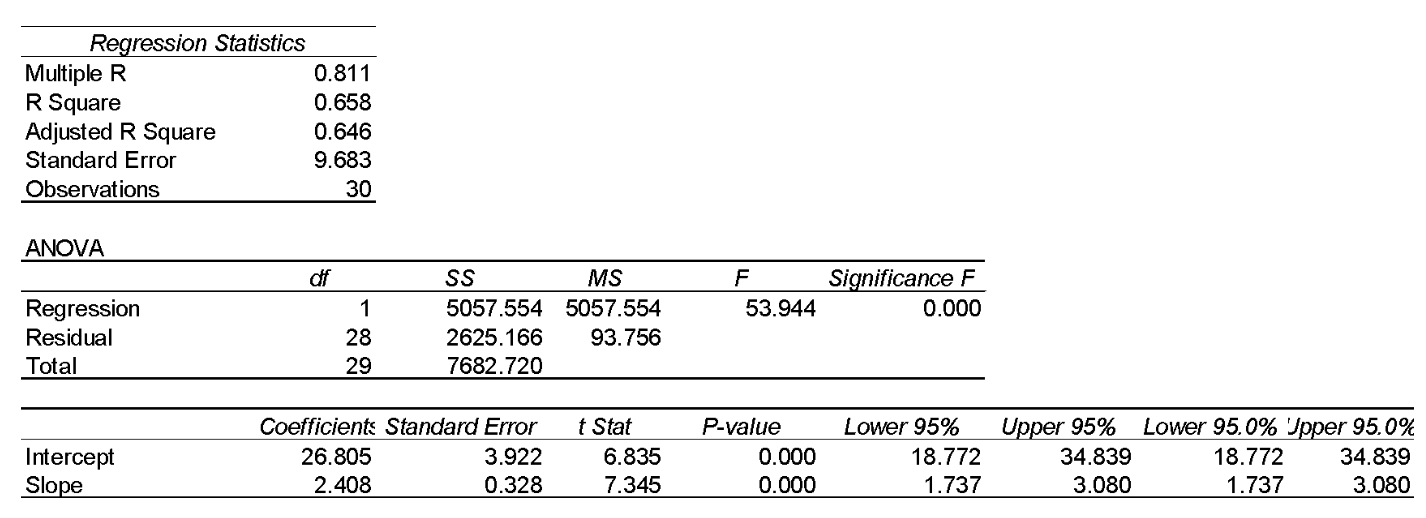
Simple Linear Regression Analysis Output
a. What is the sample size? b. Write out the regression equation. Interpret the slope and intercept values. c. If the value of the independent variable is 10, what is the estimate of the value of the dependent variable? d. Calculate the coefficient of determination. Interpret the value. e. Calculate the correlation coefficient. Interpret the value f. Conduct a test of hypothesis to determine a statistical significance of the slope and the
2. What are the assumptions in the multiple regression analysis, explain each assumption.
Regression Statistics Multiple R 0.811 R Square 0.658 Adjusted R Square 0.646 Standard Error 9.683 Observations 30 ANOVA of F 53.944 Significance F 0.000 Regression Residual Total 1 28 29 SS MS 5057.554 5057.554 2625.166 93.756 7682.720 Intercept Slope Coefficients Standard Error 26.805 3.922 2.408 0.328 t Stat 6.835 7.345 P-value 0.000 0.000 Lower 95% 18.772 1.737 Upper 95% Lower 95.0% Upper 95.0% 34.839 18.772 34.839 3.080 1.737 3.080
Step by Step Solution
There are 3 Steps involved in it

Get step-by-step solutions from verified subject matter experts