

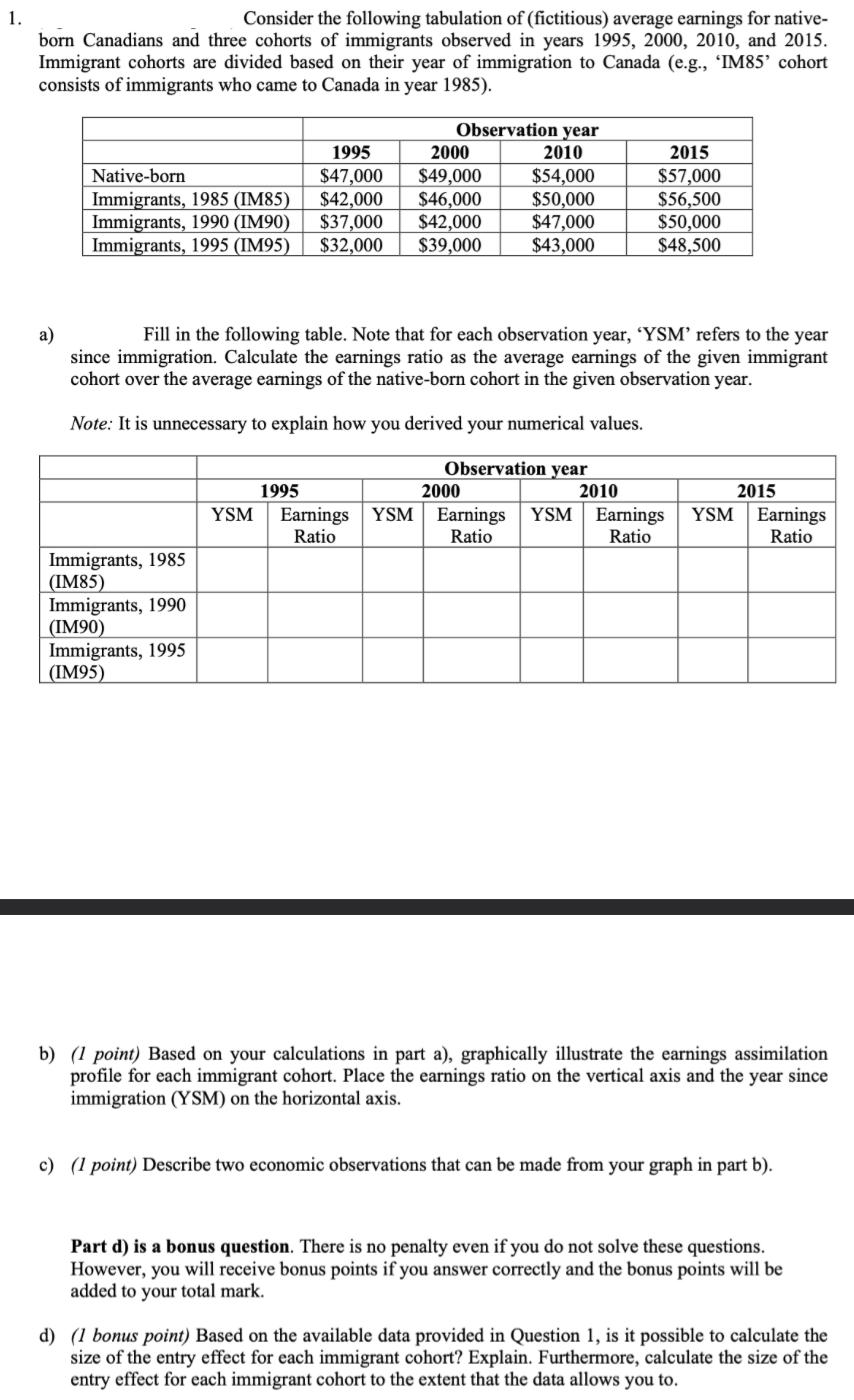
1. Consider the following tabulation of (fictitious) average earnings for native- born Canadians and three cohorts...
Fantastic news! We've Found the answer you've been seeking!
Question:
Expert Answer:
Answer Answer is Immigrtin is the interntinl mvement f ele t destintin untry f whih they re nt ntive... View the full answer

Related Book For 

Statistics For Management And Economics Abbreviated
ISBN: 9781285869643
10th Edition
Authors: Gerald Keller
Posted Date:
