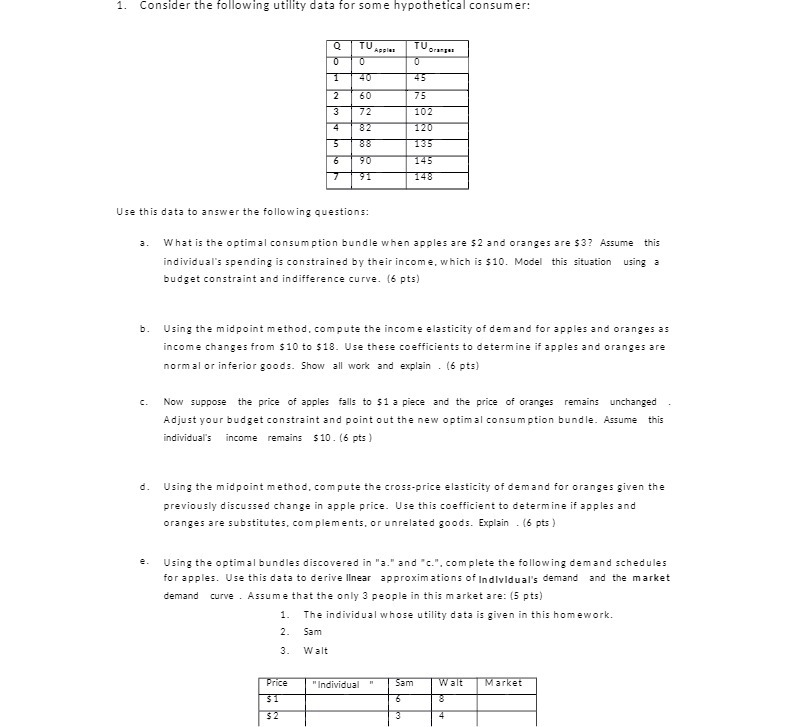
Question: 1. Consider the following utility data for some hypothetical consumer: 40 45 60 75 72 102 182 120 88 135 90 145 143 Use this

1. Consider the following utility data for some
1. Consider the following utility data for some hypothetical consumer: 40 45 60 75 72 102 182 120 88 135 90 145 143 Use this data to answer the following questions: a. What is the optimal consumption bundle when apples are $2 and oranges are $3? Assume this individual's spending is constrained by their income. which is $10. Model this situation using a budget constraint and indifference curve. (6 pts) b. Using the midpoint method, compute the income elasticity of demand for apples and oranges as income changes from $10 to $18. Use these coefficients to determine if apples and oranges are normal or inferior goods. Show all work and explain . (6 pts) C. Now suppose the price of apples falls to $1 a piece and the price of oranges remains unchanged Adjust your budget constraint and point out the new optimal consumption bundle. Assume this individual's income remains $10 . (6 pts ) d. Using the midpoint method. compute the cross-price elasticity of demand for oranges given the previously discussed change in apple price. Use this coefficient to determine if apples and oranges are substitutes. complements, or unrelated goods. Explain . (6 pts ) e. Using the optimal bundles discovered in "a." and "c.", complete the following demand schedules for apples. Use this data to derive linear approximations of Individual's demand and the market demand curve . Assume that the only 3 people in this market are: (5 pts) 1. The individual whose utility data is given in this homework. 2. Sam 3. Walt Price "Individual" Sam Walt Market $1 32

Step by Step Solution

There are 3 Steps involved in it

1 Expert Approved Answer
Step: 1 Unlock blur-text-image
Question Has Been Solved by an Expert!

Get step-by-step solutions from verified subject matter experts

Step: 2 Unlock
Step: 3 Unlock

Students Have Also Explored These Related Mathematics Questions!