

Question: 1. Consider the function f1(x) = Ax + Bln(x); A = 1; B = 1; x > 0. Show a plot of the function;
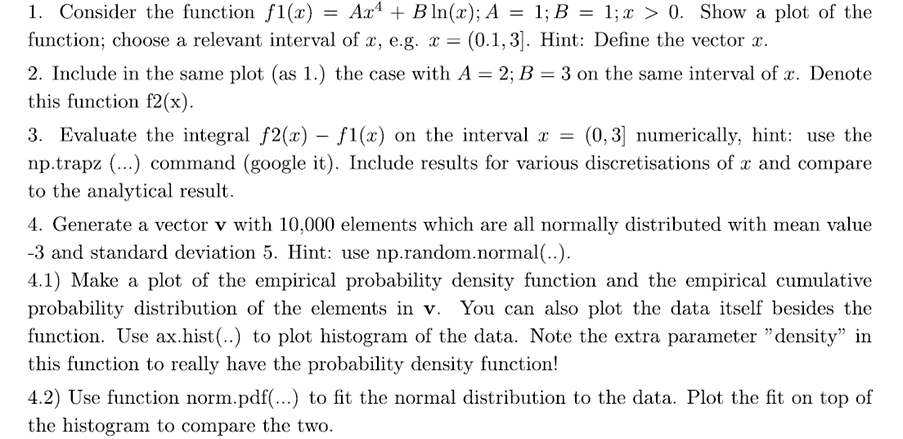
1. Consider the function f1(x) = Ax + Bln(x); A = 1; B = 1; x > 0. Show a plot of the function; choose a relevant interval of x, e.g. x = (0.1,3]. Hint: Define the vector x. 2. Include in the same plot (as 1.) the case with A = 2; B = 3 on the same interval of x. Denote this function f2(x). 3. Evaluate the integral f2(x) - f1(x) on the interval x = (0,3] numerically, hint: use the np.trapz (...) command (google it). Include results for various discretisations of x and compare to the analytical result. 4. Generate a vector v with 10,000 elements which are all normally distributed with mean value -3 and standard deviation 5. Hint: use np.random.normal(..). 4.1) Make a plot of the empirical probability density function and the empirical cumulative probability distribution of the elements in v. You can also plot the data itself besides the function. Use ax.hist(..) to plot histogram of the data. Note the extra parameter "density" in this function to really have the probability density function! 4.2) Use function norm.pdf(...) to fit the normal distribution to the data. Plot the fit on top of the histogram to compare the two.
Step by Step Solution
There are 3 Steps involved in it

Get step-by-step solutions from verified subject matter experts