

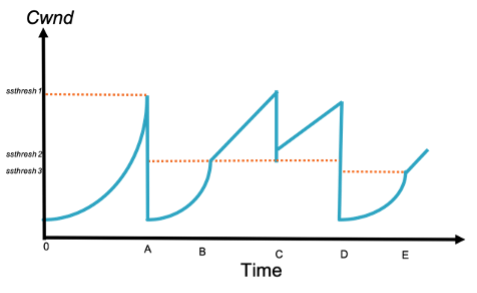
Question: 1 . Consider the graph shown in Figure 1 which shows the TCP congestion window ( Cwnd ) vs . transmission round for a TCP
Consider the graph shown in Figure which shows the TCP congestion window Cwnd vs transmission round for a TCP connection
i Determine the value of ssThershold and the Cwnd for the transmission round A
ii Explain what happened for the transmission round B
iii. At the transmission round C explain if the change is due to triple duplicate ack received or time out at the sender side? Determine the new values of ssThershold and the Cwnd
iv At the transmission round D explain the event that happened and determine the values of ssThershold and the Cwnd
Step by Step Solution
There are 3 Steps involved in it
1 Expert Approved Answer
Step: 1 Unlock

Question Has Been Solved by an Expert!
Get step-by-step solutions from verified subject matter experts
Step: 2 Unlock
Step: 3 Unlock