

Question: 1 Consider the islands vector discussed in this section. (a) Compare the histograms that result when using breaks based on Sturges' and Scott's rules. Make


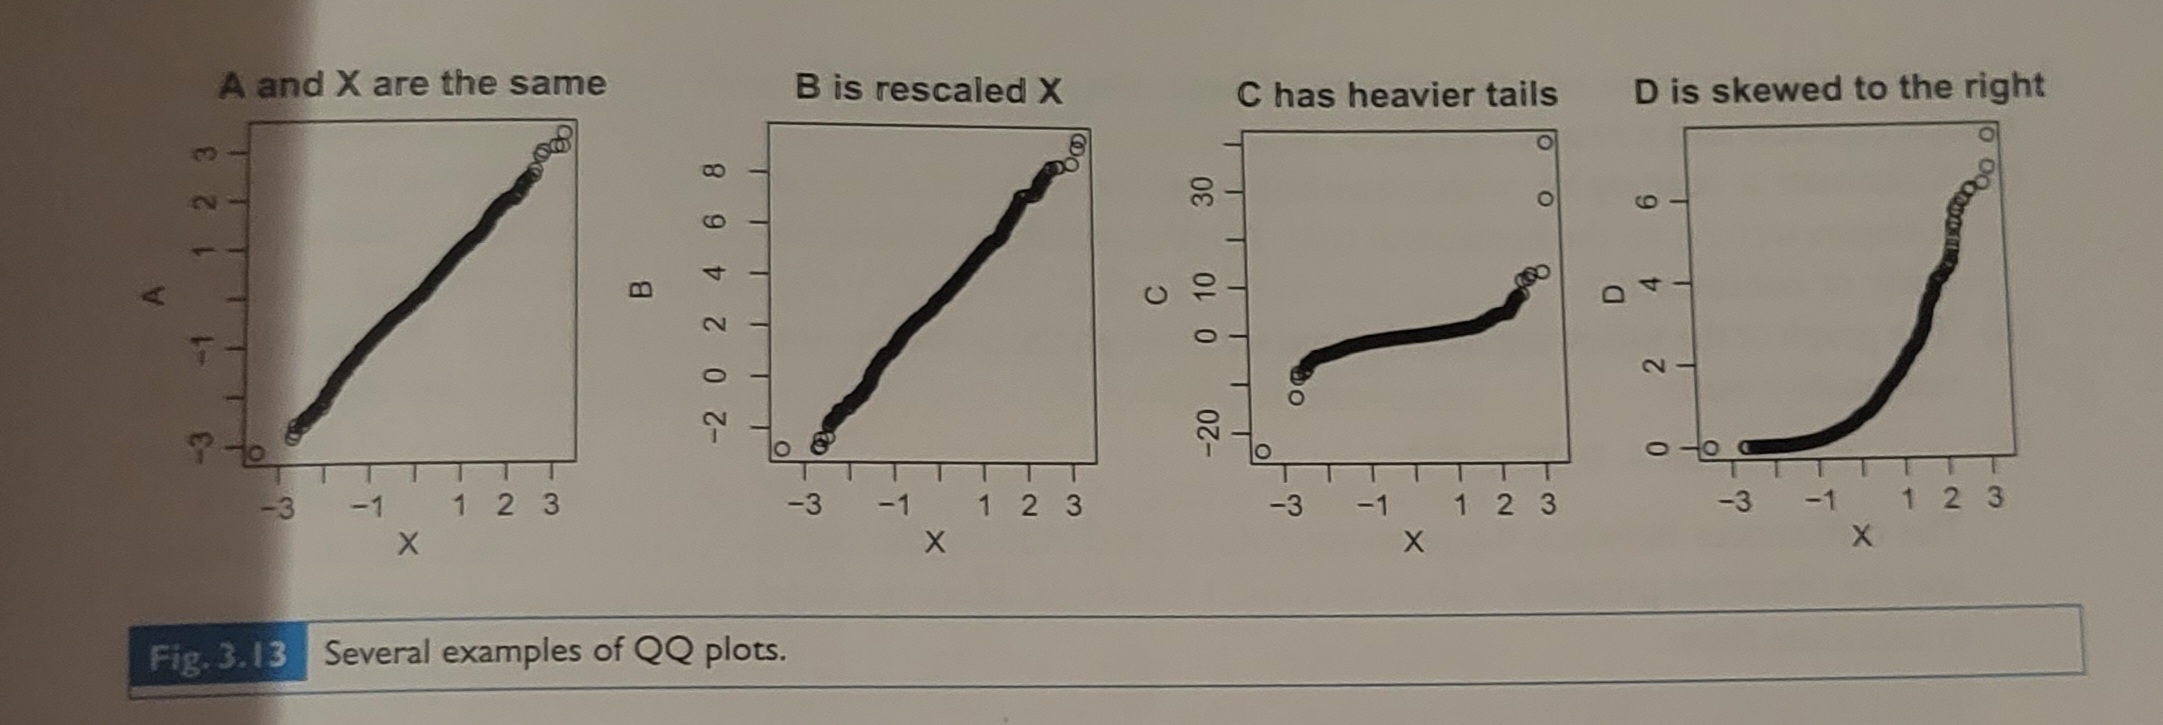
1 Consider the islands vector discussed in this section. (a) Compare the histograms that result when using breaks based on Sturges' and Scott's rules. Make this comparison on the log scale and on the original scale. (b) Construct a normal QQ plot, and compare the result with the plots in Figure 3.13; which one is most similar, and what does this tell you about this data set? (c) Construct a boxplot for these data on the log scale as well as the original scale. (d) Construct a dot chart of the areas. Is a log transformation needed here? (e) Which form of graphic do you think is most appropriate for display- ing these data?A and X are the same B is rescaled X C has heavier tails D is skewed to the right bo O -2 0 2 4 6 8 0 10 O -20 O 2 3 -3 1 23 -3 X 1 2 3 -3 -1 1 2 3 X X X Fig. 3.13 Several examples of QQ plots
Step by Step Solution
There are 3 Steps involved in it

Get step-by-step solutions from verified subject matter experts