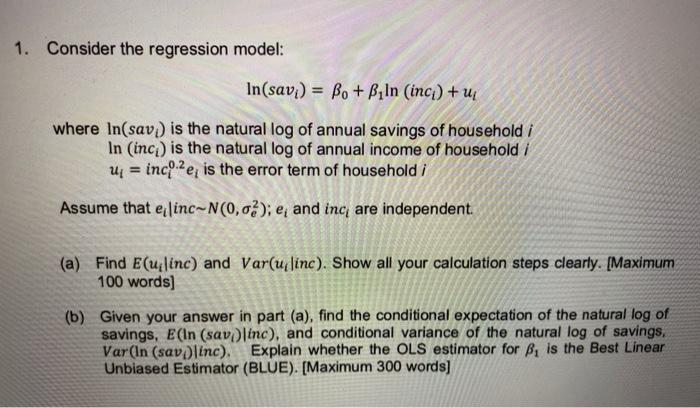
Question: 1. Consider the regression model: In(savi) = Bo + B, In (inct) + uz where In(sav) is the natural log of annual savings of household

1. Consider the regression model: In(savi) = Bo +
1. Consider the regression model: In(savi) = Bo + B, In (inct) + uz where In(sav) is the natural log of annual savings of household i In (inci) is the natural log of annual income of household / Up = incl.2 e, is the error term of household i Assume that elinc-N(0,0%); e, and inc are independent (a) Find E(ulinc) and Var(u linc). Show all your calculation steps clearly. [Maximum 100 words) (b) Given your answer in part (a), find the conditional expectation of the natural log of savings, E(In (sav)linc), and conditional variance of the natural log of savings, Var(In (sav)linc). Explain whether the OLS estimator for B, is the Best Linear Unbiased Estimator (BLUE). [Maximum 300 words) TABLE 2 Critical Values for Two-Sided and One-Sided Tests Using the Student Distribution Significance Level Degrees of Freedom 20% (2-Sided) 10% (1-Sided) 10% 12-Sided) 5% (1-Sided) 5% (2-Sided) 2.5% 11-Sided) 29 (2-Sided) 1% 11-Sidedi 1% (2-Sided) 0.5% (1-Sided) 1 2 3 4 3.08 1.89 1.64 1.53 1.48 1.44 1.41 1.40 1.38 1.37 1.36 1.36 1.35 1.35 1.34 1.34 133 1.33 5 6 7 8 9 10 11 12 13 14 15 16 17 18 19 20 21 22 23 24 25 26 27 28 29 30 60 90 120 6,31 2.92 2.35 2.13 2.02 1.94 1.89 1.86 1.83 1.81 1.80 1.78 1.77 1.76 1.75 1.75 1.74 1.73 1.73 1.72 1.72 1.72 1.71 1.71 1.71 1.71 1.70 1.70 1.70 1.70 1.67 1.66 166 1.64 12.71 4.30 3.18 2.78 2.57 2.45 2.36 2.31 2.26 2.23 2.20 2.18 2.16 2.14 2.13 2.12 211 2.10 2.09 2.09 2.08 2.07 2.07 2.06 2.06 2.06 2.05 2.05 2.05 31.82 6.96 4.54 3.75 3.36 3.14 3.00 2.90 2.82 2.76 2.72 2.68 265 2.62 2.60 2.58 2.57 2.55 254 253 2.52 2.51 2.50 2.49 2.49 248 2.47 2.47 2.46 2.46 2.39 2.37 2.36 2.33 63.66 9.92 5.84 4.60 4.03 3.71 3.50 3.36 3.25 3.17 3.11 3.05 3.01 2.98 2.95 2.92 2.90 2.88 2.86 2.RS 2.83 2.82 2.81 2.80 2.79 2.78 2.77 2.76 2.76 2.75 2.66 2.63 2.62 2.58 1.33 1.32 1.32 1.32 1.32 132 1.32 1.31 1.31 1.31 1.31 1.30 129 1.29 1.28 2.04 2.00 1.99 1.98 1.96 Values are shown for the critical as for two-sided) and one sided (>) alternative hypotheses. The critical value for the one-sided () test is the negative of the wided critical shown in the table. For example, 2.13 is the critical value for a Two-sided test with a significance level of 5% wsing the Student distribution with 15 degrees of freedom TABLE4 Critical Values for the Fr Distribution Area - Significance Level Critical Value Significance Level Degrees of Freedom 101 59 19 3.84 3.00 2.60 2.37 2.21 2.10 2.01 1.94 1.88 1.83 1.79 1.75 1.72 1 2 3 4 5 6 7 8 9 10 11 12 13 14 15 16 17 18 19 20 21 22 23 24 25 26 27 28 29 30 2.71 2.30 2.08 1.94 1.85 1.77 1.72 1.67 1.63 1.60 1.57 1.55 1.52 1.50 1.49 1.47 1.46 1.44 143 1.42 1.41 1.40 1.39 1.38 1.38 1.37 1.36 1.35 1.35 1.34 1.69 1.67 1.64 1.62 1.60 1.59 1.57 1.56 1.54 1.53 1.52 1.SI 1.50 1.49 1.48 1.47 1.46 6.63 4.61 3.78 3.32 3.02 2.80 264 2.51 2.41 2.32 2.25 2.18 2.13 2.08 2.04 2.00 1.97 1.93 1.90 1.88 1.85 1.83 1.81 1.79 1.77 1.76 1.74 1.72 1.71 1.710 This table contains the grand 9 percentils of the level of 10

Step by Step Solution

There are 3 Steps involved in it

1 Expert Approved Answer
Step: 1 Unlock blur-text-image
Question Has Been Solved by an Expert!

Get step-by-step solutions from verified subject matter experts

Step: 2 Unlock
Step: 3 Unlock

Students Have Also Explored These Related General Management Questions!