

Question: 1. Consider the table below. All data are for 2017 and are in billions of US Dollars, except for the CPI, which is a percentage.
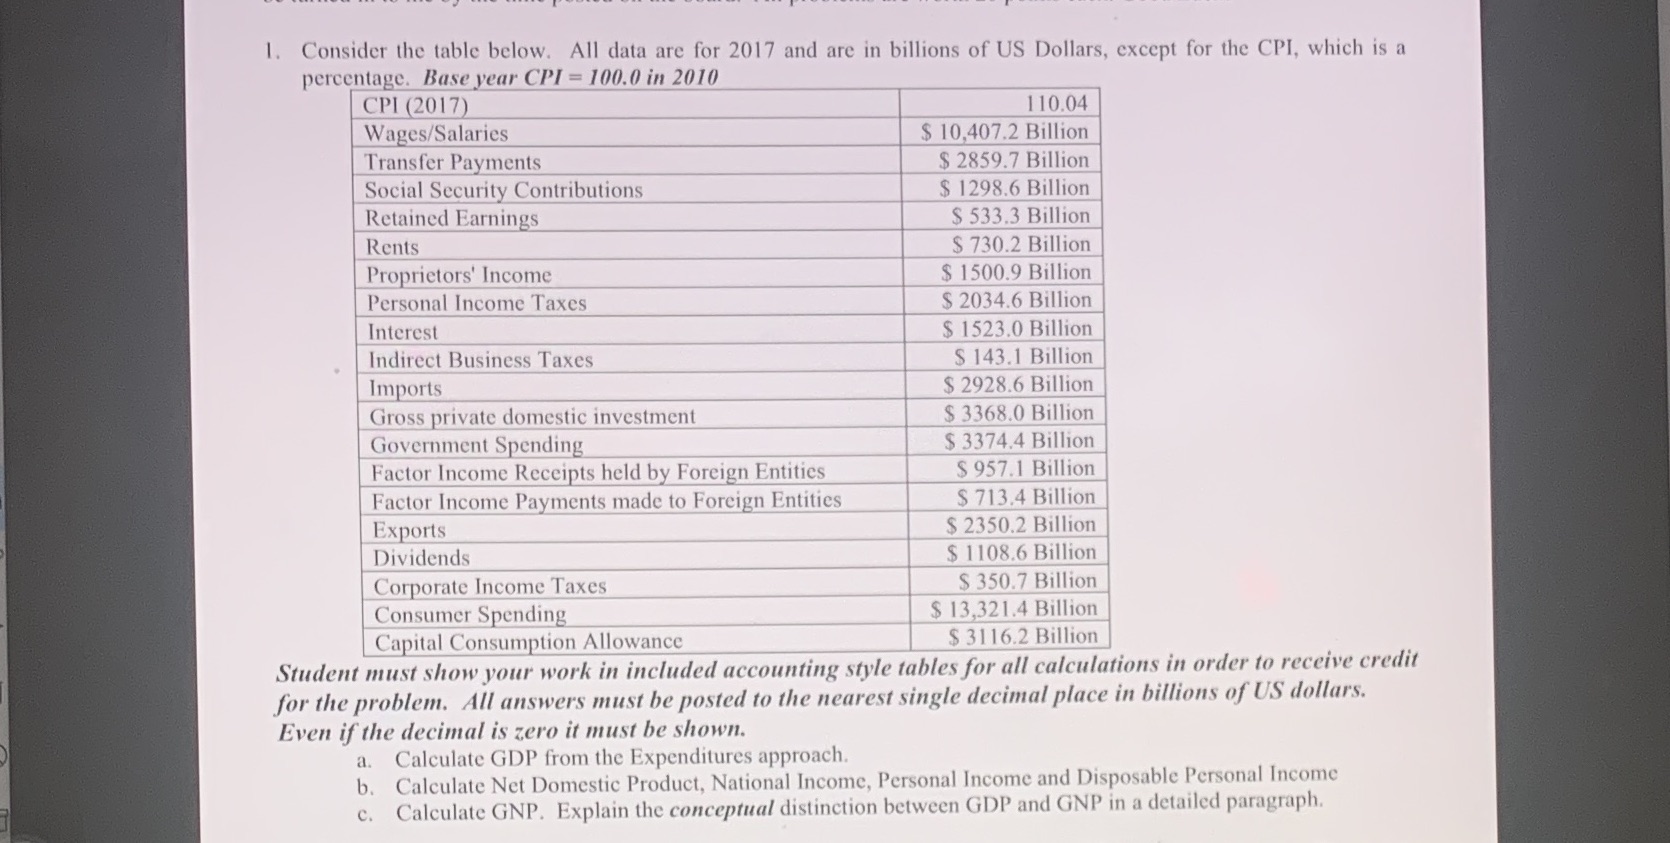
1. Consider the table below. All data are for 2017 and are in billions of US Dollars, except for the CPI, which is a percentage. Base year CPI = 100.0 in 2010 CPI (2017) 1 10.04 Wages/Salaries $ 10,407.2 Billion Transfer Payments $ 2859.7 Billion Social Security Contributions $ 1298.6 Billion Retained Earnings $ 533.3 Billion Rents $ 730.2 Billion Proprietors' Income $ 1500.9 Billion Personal Income Taxes $ 2034.6 Billion Interest $ 1523.0 Billion Indirect Business Taxes $ 143.1 Billion Imports $ 2928.6 Billion Gross private domestic investment $ 3368.0 Billion Government Spending $ 3374.4 Billion Factor Income Receipts held by Foreign Entities $ 957.1 Billion Factor Income Payments made to Foreign Entities $ 713.4 Billion Exports $ 2350.2 Billion Dividends $ 1 108.6 Billion Corporate Income Taxes $ 350.7 Billion Consumer Spending $ 13,321.4 Billion Capital Consumption Allowance $ 3116.2 Billion Student must show your work in included accounting style tables for all calculations in order to receive credit for the problem. All answers must be posted to the nearest single decimal place in billions of US dollars. Even if the decimal is zero it must be shown. a. Calculate GDP from the Expenditures approach. b. Calculate Net Domestic Product, National Income, Personal Income and Disposable Personal Income c. Calculate GNP. Explain the conceptual distinction between GDP and GNP in a detailed paragraph
Step by Step Solution
There are 3 Steps involved in it

Get step-by-step solutions from verified subject matter experts