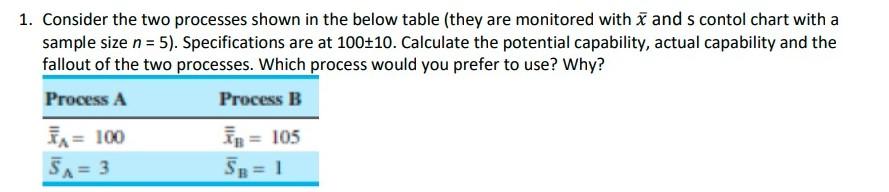
Question: 1. Consider the two processes shown in the below table (they are monitored with x and scontol chart with a sample size n = 5).

1. Consider the two processes shown in the below

1. Consider the two processes shown in the below table (they are monitored with x and scontol chart with a sample size n = 5). Specifications are at 100:10. Calculate the potential capability, actual capability and the fallout of the two processes. Which process would you prefer to use? Why? Process A Process B in = 100 In = 105 5A= 3 S8= 1

Step by Step Solution

There are 3 Steps involved in it

1 Expert Approved Answer
Step: 1 Unlock blur-text-image
Question Has Been Solved by an Expert!

Get step-by-step solutions from verified subject matter experts

Step: 2 Unlock
Step: 3 Unlock

Students Have Also Explored These Related General Management Questions!