

Question: 1. Construct a frequency table and frequency histogram for heights of adult males. Use a first class of 64.00 - 65.99. On the histogram, use
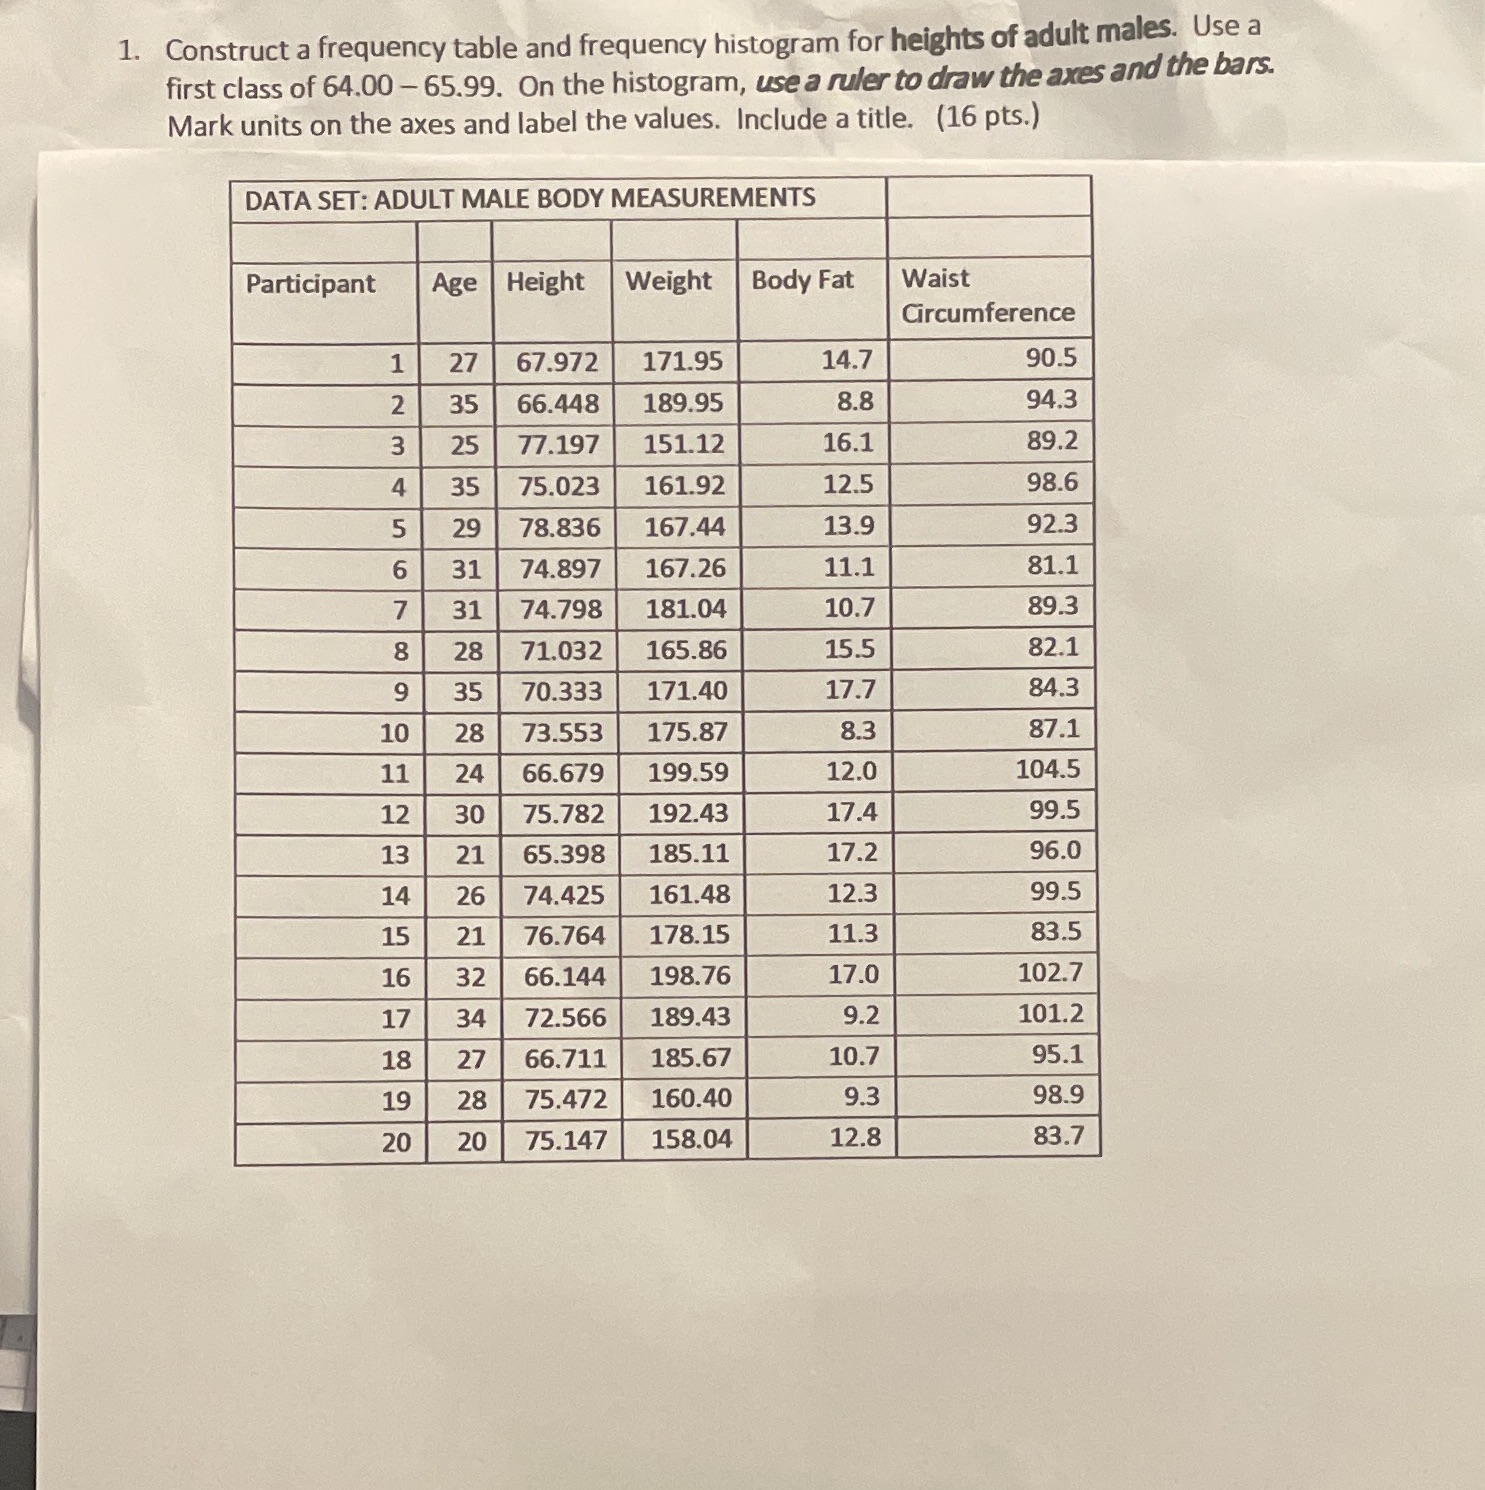
1. Construct a frequency table and frequency histogram for heights of adult males. Use a first class of 64.00 - 65.99. On the histogram, use a ruler to draw the axes and the bars. Mark units on the axes and label the values. Include a title. (16 pts.) DATA SET: ADULT MALE BODY MEASUREMENTS Participant Age | Height Weight Body Fat Waist Circumference 1 27 67.972 171.95 14.7 90.5 2 35 66.448 189.95 8.8 94.3 3 25 77.197 151.12 16.1 89.2 4 35 75.023 161.92 12.5 98.6 5 29 78.836 167.44 13.9 92.3 6 31 74.897 167.26 11.1 81.1 7 31 74.798 181.04 10.7 89.3 8 71.032 165.86 15.5 82.1 9 35 70.333 171.40 17.7 84.3 10 28 73.553 175.87 8.3 87.1 11 24 66.679 199.59 12.0 104.5 12 30 75.782 192.43 17.4 99.5 13 21 65.398 185.11 17.2 96.0 14 26 74.425 161.48 12.3 99.5 15 21 76.764 178.15 11.3 83.5 16 32 66.144 198.76 17.0 102.7 17 34 72.566 189.43 9.2 101.2 18 27 66.711 185.67 10.7 95.1 19 28 75.472 160.40 9.3 98.9 20 20 75.147 158.04 12.8 83
Step by Step Solution
There are 3 Steps involved in it

Get step-by-step solutions from verified subject matter experts