

Question: 1) Construct control charts for ranges and means using the following table. Are any samples beyond the control limits? Size of Sample (n) Factor
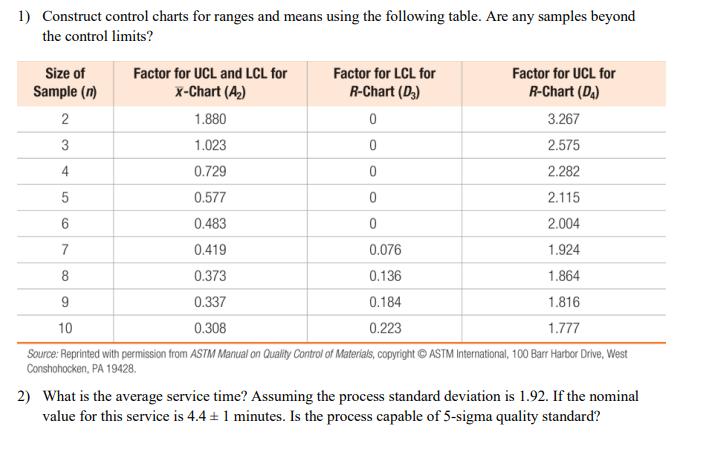
1) Construct control charts for ranges and means using the following table. Are any samples beyond the control limits? Size of Sample (n) Factor for UCL and LCL for Factor for LCL for Factor for UCL for X-Chart (A) R-Chart (D3) R-Chart (D4) 2 1.880 0 3.267 3 1.023 0 2.575 4 0.729 0 2.282 5 0.577 0 2.115 6 0.483 0 2.004 7 0.419 0.076 1.924 8 0.373 0.136 1.864 9 0.337 0.184 1.816 10 0.308 0.223 1.777 Source: Reprinted with permission from ASTM Manual on Quality Control of Materials, copyright ASTM International, 100 Barr Harbor Drive, West Conshohocken, PA 19428. 2) What is the average service time? Assuming the process standard deviation is 1.92. If the nominal value for this service is 4.4 1 minutes. Is the process capable of 5-sigma quality standard?
Step by Step Solution
There are 3 Steps involved in it

Get step-by-step solutions from verified subject matter experts