

Question: 1) Construct Financial Statements using Excel. Your group's Job is to fill out the values for the years 2014 (current) and the 2015 (projected) in
1) Construct Financial Statements using Excel.
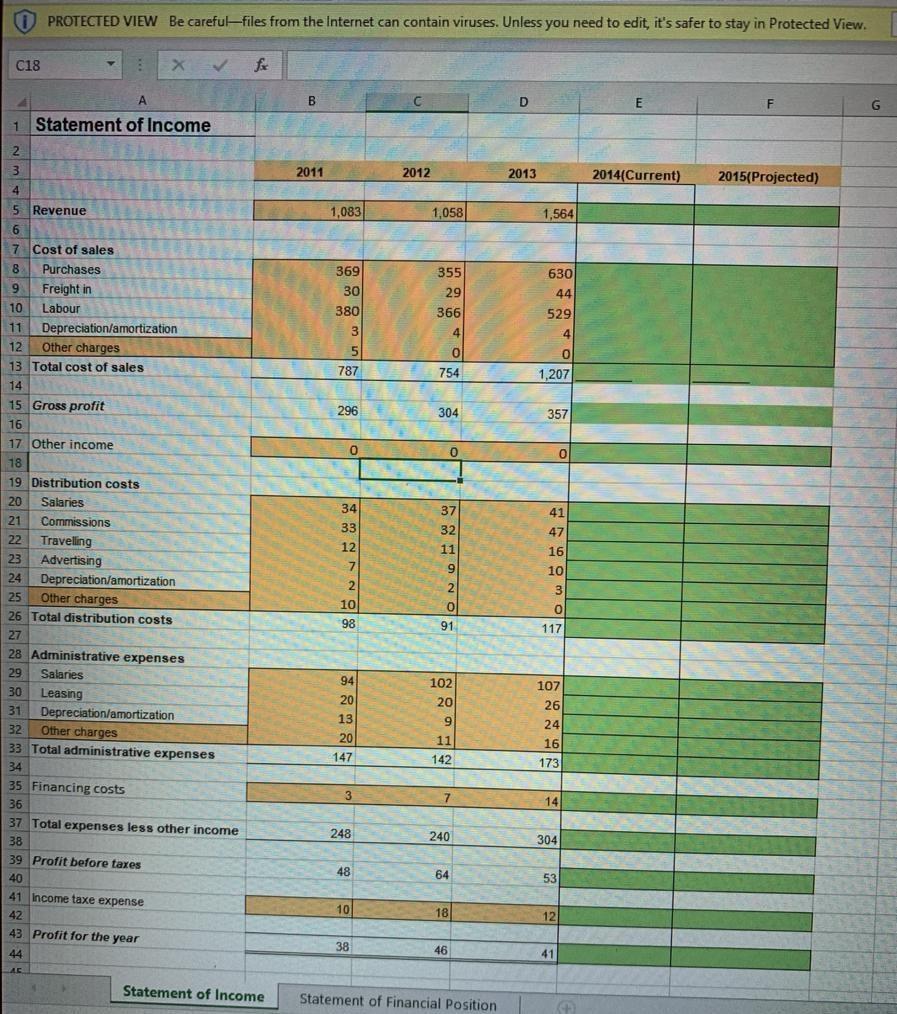
Your group's Job is to fill out the values for the years 2014 (current) and the 2015 (projected) in the Statement of Income and Statement of Financial Position (fill all the green cells). If no information is given about a particular value assume it is the same as last years. Pay close attention to the potential sources of financing, adjust the Statement of Income and Statement of Financial Position accordingly in excel. When you are finished with the Excel Document save it as Group#ABCCorpA1. All Values shown in Excel are in thousands of dollars.
2) Ratio Analysis (Read the CASE and complete step 1 FIRST)
Calculate and analyze the following Ratios for the years 2014 and 2015. What do you notice about the change in these Ratios? Provide a brief explanation for the reason of the change, or whether the Ratios below should be any cause for concern.
Current Ratio, Return on Assets , Quick Ratio, Net Working Captial
3) Discussion Questions (Read the CASE and complete step 1 FIRST)
i) Did you decide to Rent or Buy the Warehouse? Why? (Hint: Compare the cost of financing)
ii) In the Statement of Financial Position explain why there are only zero's at the bottom, what does this signify? (Located on sheet 2 Row 47 in the excel file).
i) Explain your team's plan to finance the purchase of the additional inventory and warehouse? What is the total cost of the expansion? What is the total cost of financing for the expansion? (Hint: The company has been preapproved for a short-term loan, as well as has access to retained earnings from the previous year
THE CASE:
It is currently Q4 in 2014 and ABC corporation has placed your team in charge of preparing the company's Income Statement and Balance Sheet (Statement of Financial Position) for 2014, as well as the projected statements for 2015. You are told that sale revenue has increased 6% from the 2013 values. ABC Company also plans to expand their inventory to meet growing demand and they forecast sales revenue to increase by 35% in 2015 (from current values). 40,045.00$ of additional purchases were made in 2014 (Paid for with Retained Earnings), with another 230,545.00 planned to be purchased in the future to expand inventory in 2015. Along with the increase in inventory, Freight expenses are expected to double. ABC has been preapproved a short-term loan in the amount of $100,000 today to be repaid in full at the end of 2015 to finance this expansion, the rest will be paid for using the companies Retained Earnings. The total financing cost of the loan will be $9,500. Labour cost is expected to be the same as last year and are expected to increase by 15% in 2015. ABC is also planning to hire 2 new employees on salary, one for Distribution and one as Administrative staff in 2015, they will be paid $40,000/year each. Commissions are expected to increase by $30,000 in 2015.
Plant Property and equipment are also the same as last year (2013), however, in the coming year (2015) the company is faced with a choice to buy or rent a warehouse to house the additional inventory. The building may be purchased outright for 350,000$ or leased on a one-year term for $90,000 spilt into 12 equal monthly payments.
Assume a 15% down-payment is required to buy the land, with payments made monthly amortized over 25 years, and the interest rate on the mortgage is fixed at 2.5%. Whether you decid to rent or buy the land is up to your team to decide, either way provide a rationale and adjust your financial statements for the projected year accordingly.
**If you choose 'buy', add the principal payments of the loan for 12 months and include them in the "current portion of long term debt" cell in the Statement of Financial Position.
Add the total financing cost of the loan (interest portion less the principal) for 12 months and add to existing financing costs (Cell A35) in the Statement of Income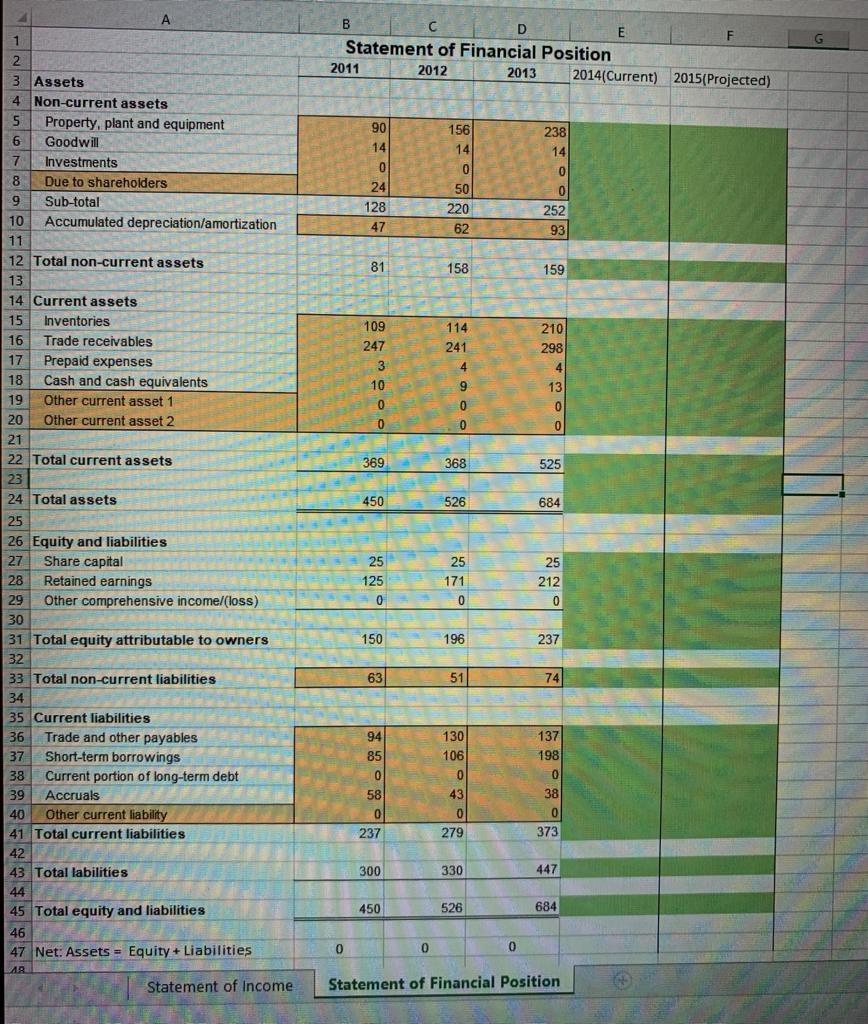
A 1 B D E F Statement of Financial Position 2011 2012 2013 2014(current) 2015(Projected) 90 156 238 14 14 14 0 0 0 24 50 0 128 220 2 3 Assets 4 Non-current assets Property, plant and equipment 6 Goodwill 7 Investments 8 Due to shareholders 9 Sub-total 10 Accumulated depreciation/amortization 11 12 Total non-current assets 13 14 Current assets 15 Inventories 16 Trade receivables 17 Prepaid expenses 18 Cash and cash equivalents 19 Other current asset 1 252 93 47 62 81 158 159 109 114 210 298) 247 241 3 4 4 10 9 13 0 0 0 20 Other current asset 2 0 0 0 21 22 Total current assets 369 368 525 23 450 526 684 25 25 25 125 171 212 0 0 0 150 196 237 63 51 74 24 Total assets 25 26 Equity and liabilities 27 Share capital 28 Retained earnings 29 Other comprehensive income/loss) 30 31 Total equity attributable to owners 32 33 Total non-current liabilities 34 35 Current liabilities 36 Trade and other payables 37 Short-term borrowings 38 Current portion of long-term debt 39 Accruals 40 Other current liability 41 Total current liabilities 42 43 Total labilities 44 45 Total equity and liabilities 46 47 Net: Assets = Equity + Liabilities 137 130 106 198 94 85 0 58 0 0 43 38 0 0 0 237 279 373 300 330 447 450 526 684 0 0 0 AR Statement of Income Statement of Financial Position PROTECTED VIEW Be carefulfiles from the Internet can contain viruses. Unless you need to edit, it's safer to stay in Protected View. C18 X B D E F 1 Statement of Income 2 3 2011 2012 2013 2014(Current) 2015(Projected) 4 5 Revenue 1,083 1,058 1,564 6 7 Cost of sales 8 Purchases 369 355 630 9 30 29 Freight in Labour 44 10 380 366 529 3 4 4 11 Depreciation/amortization 12 Other charges 13 Total cost of sales 5 O O 754 787 1,207 14 15 Gross profit 296 304 357 16. 17 Other income 0 0 18 19 Distribution costs 20 Salaries 21 Commissions 37 34 33 41 32 47 12 11 16 7 9 10 2 2 3 10 0 0 98 91 117 94 102 22 Travelling 23 Advertising 24 Depreciation/amortization 25 Other charges 26 Total distribution costs 27 28 Administrative expenses 29 Salaries 30 Leasing 31 Depreciation/amortization 32 Other charges 33 Total administrative expenses 34 35 Financing costs 36 37 Total expenses less other income 38 107 20 20 26 13 9 24 20 11 16 147 142 173 3 7 14 248 240 304 39 Profit before taxes 48 40 64 53 41 Income taxe expense 42 43. Profit for the year 10 18 12 38 44 46 41 Statement of Income Statement of Financial Position A 1 B D E F Statement of Financial Position 2011 2012 2013 2014(current) 2015(Projected) 90 156 238 14 14 14 0 0 0 24 50 0 128 220 2 3 Assets 4 Non-current assets Property, plant and equipment 6 Goodwill 7 Investments 8 Due to shareholders 9 Sub-total 10 Accumulated depreciation/amortization 11 12 Total non-current assets 13 14 Current assets 15 Inventories 16 Trade receivables 17 Prepaid expenses 18 Cash and cash equivalents 19 Other current asset 1 252 93 47 62 81 158 159 109 114 210 298) 247 241 3 4 4 10 9 13 0 0 0 20 Other current asset 2 0 0 0 21 22 Total current assets 369 368 525 23 450 526 684 25 25 25 125 171 212 0 0 0 150 196 237 63 51 74 24 Total assets 25 26 Equity and liabilities 27 Share capital 28 Retained earnings 29 Other comprehensive income/loss) 30 31 Total equity attributable to owners 32 33 Total non-current liabilities 34 35 Current liabilities 36 Trade and other payables 37 Short-term borrowings 38 Current portion of long-term debt 39 Accruals 40 Other current liability 41 Total current liabilities 42 43 Total labilities 44 45 Total equity and liabilities 46 47 Net: Assets = Equity + Liabilities 137 130 106 198 94 85 0 58 0 0 43 38 0 0 0 237 279 373 300 330 447 450 526 684 0 0 0 AR Statement of Income Statement of Financial Position PROTECTED VIEW Be carefulfiles from the Internet can contain viruses. Unless you need to edit, it's safer to stay in Protected View. C18 X B D E F 1 Statement of Income 2 3 2011 2012 2013 2014(Current) 2015(Projected) 4 5 Revenue 1,083 1,058 1,564 6 7 Cost of sales 8 Purchases 369 355 630 9 30 29 Freight in Labour 44 10 380 366 529 3 4 4 11 Depreciation/amortization 12 Other charges 13 Total cost of sales 5 O O 754 787 1,207 14 15 Gross profit 296 304 357 16. 17 Other income 0 0 18 19 Distribution costs 20 Salaries 21 Commissions 37 34 33 41 32 47 12 11 16 7 9 10 2 2 3 10 0 0 98 91 117 94 102 22 Travelling 23 Advertising 24 Depreciation/amortization 25 Other charges 26 Total distribution costs 27 28 Administrative expenses 29 Salaries 30 Leasing 31 Depreciation/amortization 32 Other charges 33 Total administrative expenses 34 35 Financing costs 36 37 Total expenses less other income 38 107 20 20 26 13 9 24 20 11 16 147 142 173 3 7 14 248 240 304 39 Profit before taxes 48 40 64 53 41 Income taxe expense 42 43. Profit for the year 10 18 12 38 44 46 41 Statement of Income Statement of Financial Position
Step by Step Solution
There are 3 Steps involved in it

Get step-by-step solutions from verified subject matter experts