

Question: 1. Construct Research question (s) that can be answered with a Pearson correlation and bivariate regression based on the Analysis Outputs below. 2. Evaluate if
1. Construct Research question (s) that can be answered with a Pearson correlation and bivariate regression based on the Analysis Outputs below.
2. Evaluate if the correlation and bivariate regression assumptions are met and report the effect size.
3. Give a detailed analysis of the correlation and bivariate regression results for each research question.
4. Based on these results, provide an explanation of what the implications of social change might be.
| Case Processing Summary | ||||||
| Cases | ||||||
| Valid | Missing | Total | ||||
| N | Percent | N | Percent | N | Percent | |
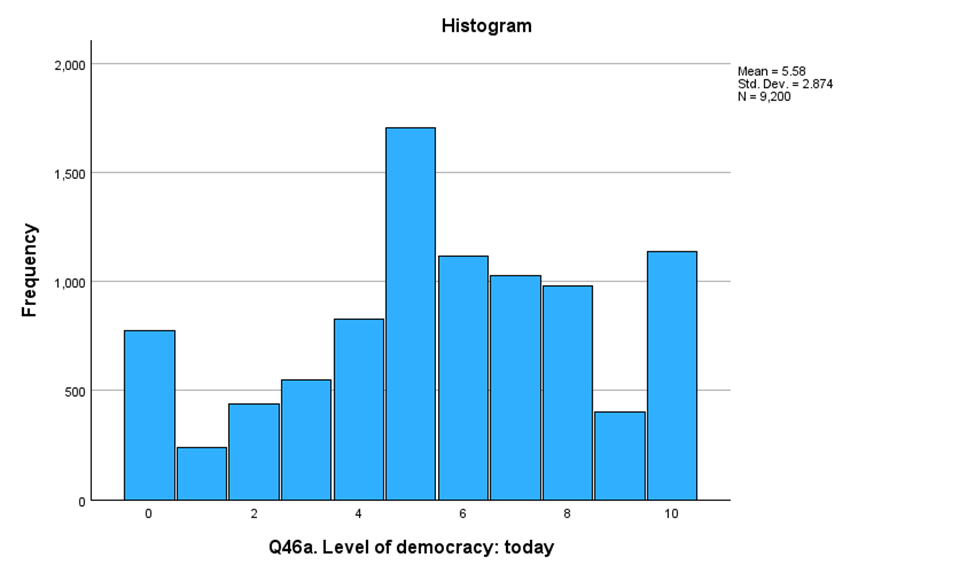
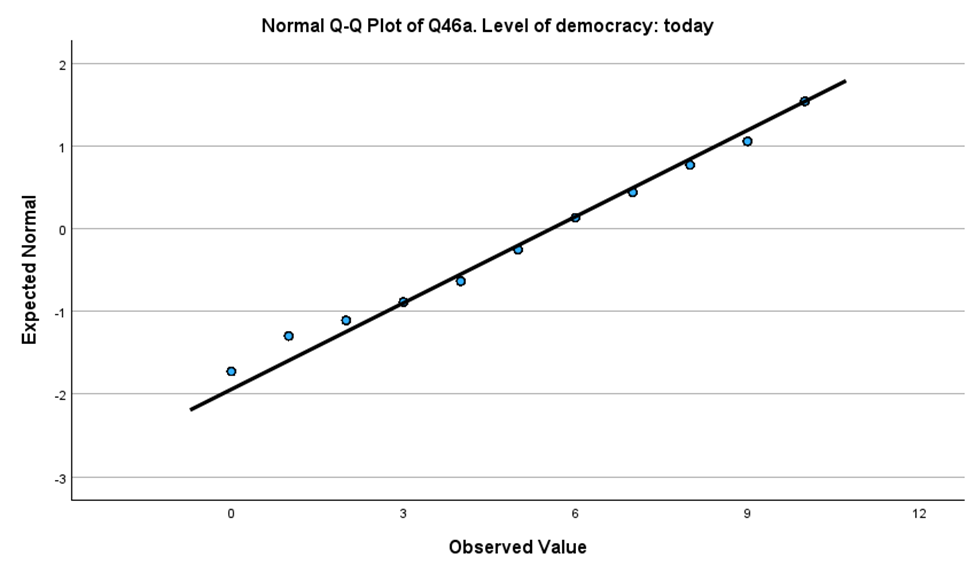
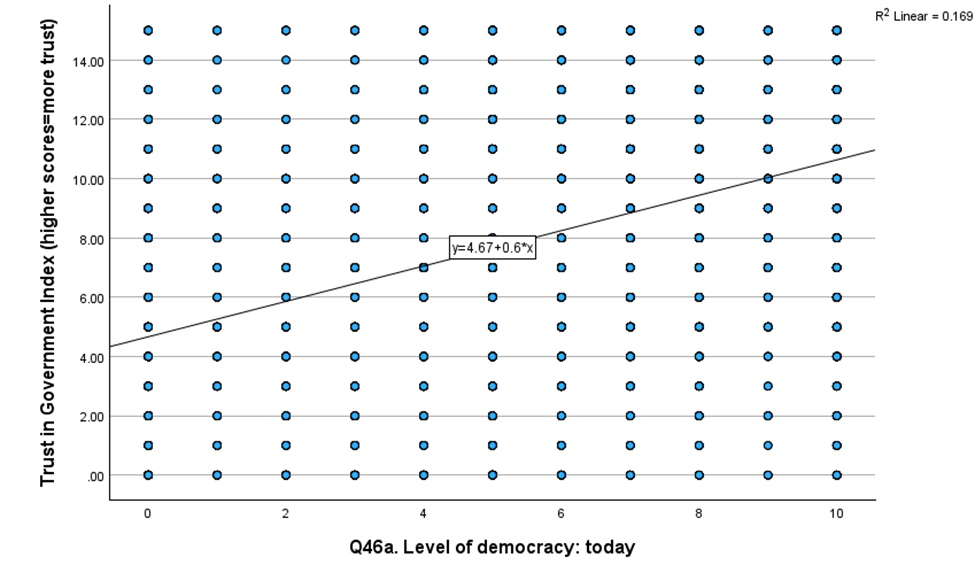
| Q46a. Level of democracy: today | 9200 | 71.7% | 3638 | 28.3% | 12838 | 100.0% |
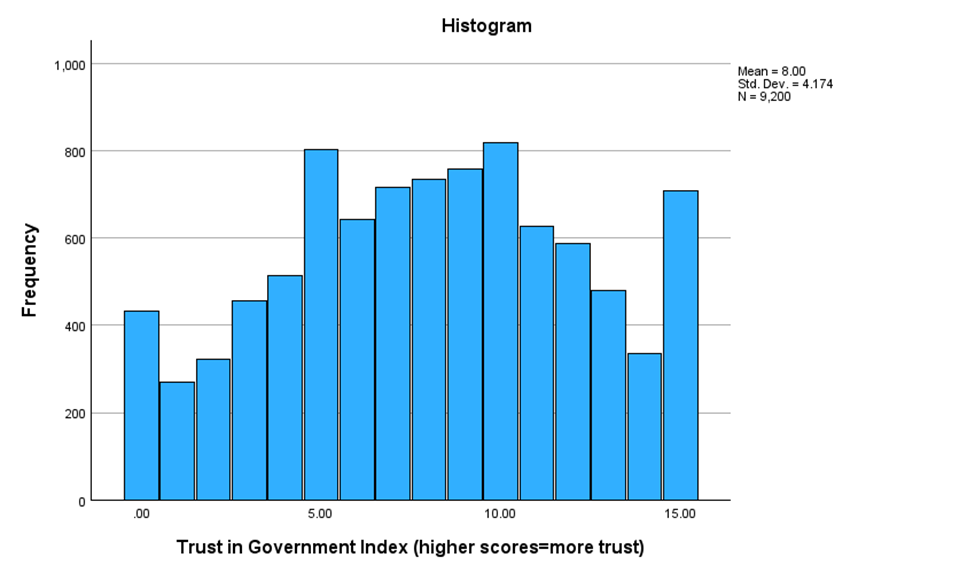
| Trust in Government Index (higher scores=more trust) | 9200 | 71.7% | 3638 | 28.3% | 12838 | 100.0% |
| Descriptives | |||
| Statistic | Std. Error | ||
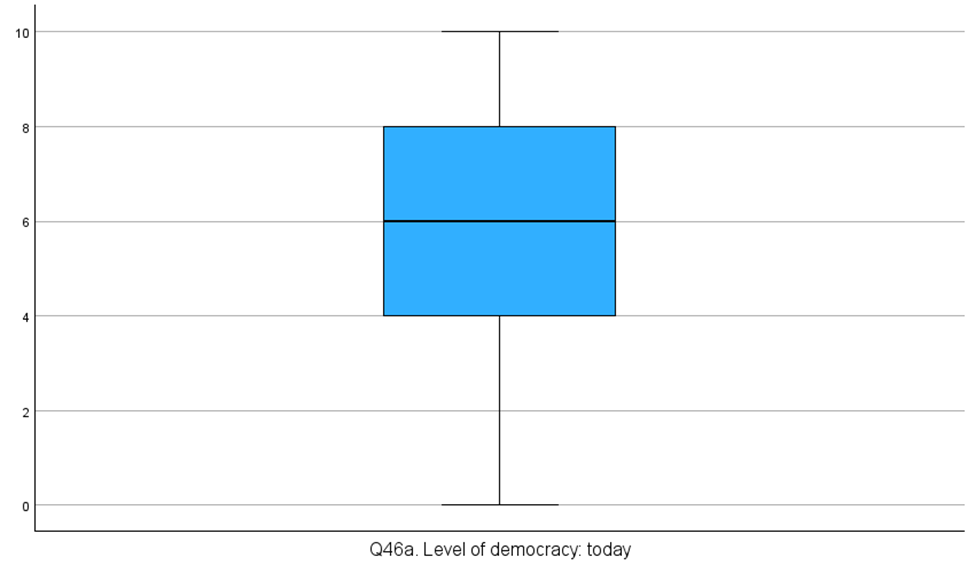
| Q46a. Level of democracy: today | Mean | 5.58 | .030 |
| 95% Confidence Interval for Mean | Lower Bound | 5.52 | |
| Upper Bound | 5.64 | ||
| 5% Trimmed Mean | 5.65 | ||
| Median | 6.00 | ||
| Variance | 8.262 | ||
| Std. Deviation | 2.874 | ||
| Minimum | 0 | ||
| Maximum | 10 | ||
| Range | 10 | ||
| Interquartile Range | 4 | ||
| Skewness | -.273 | .026 | |
| Kurtosis | -.634 | .051 | |
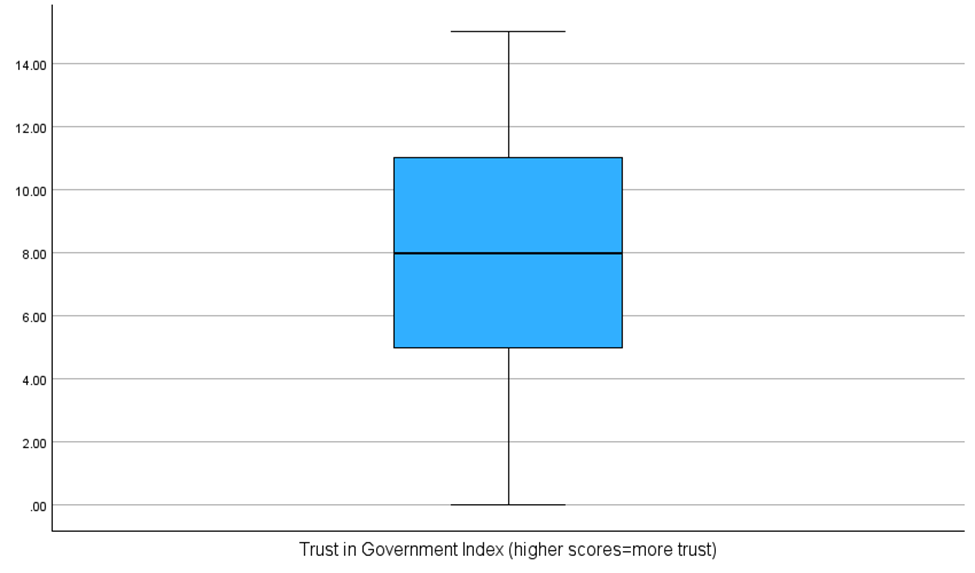
| Trust in Government Index (higher scores=more trust) | Mean | 7.9954 | .04352 |
| 95% Confidence Interval for Mean | Lower Bound | 7.9101 | |
| Upper Bound | 8.0807 | ||
| 5% Trimmed Mean | 8.0471 | ||
| Median | 8.0000 | ||
| Variance | 17.424 | ||
| Std. Deviation | 4.17419 | ||
| Minimum | .00 | ||
| Maximum | 15.00 | ||
| Range | 15.00 | ||
| Interquartile Range | 6.00 | ||
| Skewness | -.093 | .026 | |
| Kurtosis | -.862 | .051 |
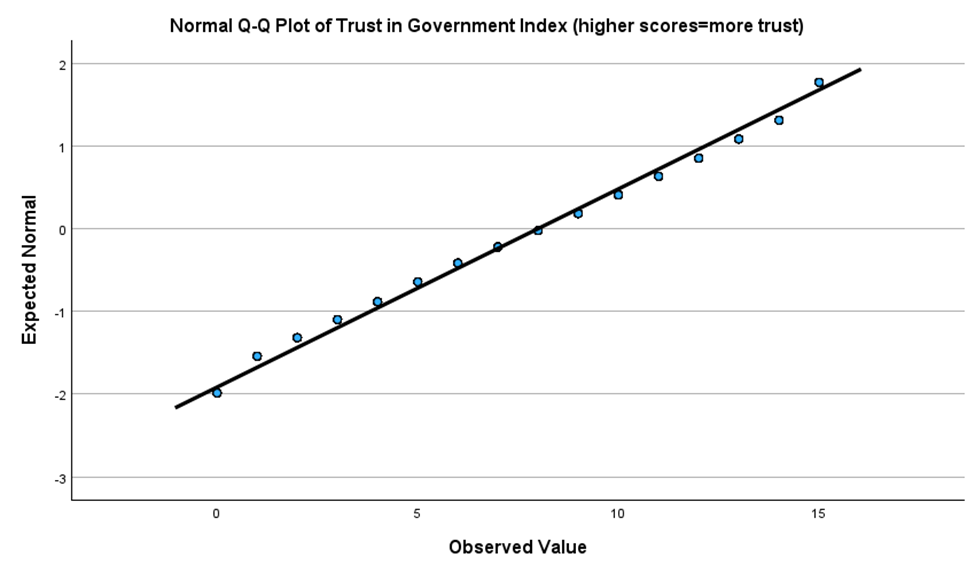
| Tests of Normality | |||
| Kolmogorov-Smirnova | |||
| Statistic | df | Sig. | |
| Q46a. Level of democracy: today | .112 | 9200 | <.001> |
| Trust in Government Index (higher scores=more trust) | .071 | 9200 | <.001> |
| a. Lilliefors Significance Correction |
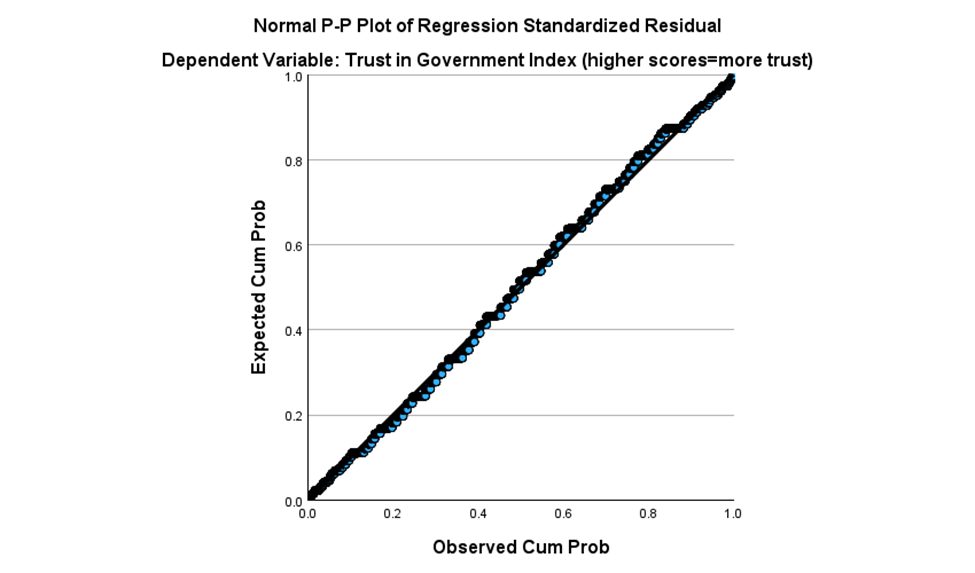
\fExpected Normal o Normal Q-Q Plot of Q46a. Level of democracy: today 3 6 Observed Value 10 8 6 2 0 Q46a. Level of democracy: todayFrequency Histogram 1,000 600 400 5.00 10.00 Trust in Government Index (higher scores=more trust) 15.00 Mean = 8.00 Std. Dev. = 4174 Expected Normal -1 o Normal Q-Q Plot of Trust in Government Index (higher scores=more trust) Observed Value 10 15 \fTrust in Government Index (higher scores=more trust) 14.00 12.00 10.00 2.00 8.00 4.00 6.00 .00 0 O O O O 0 0 0 O O O O O O O O O O O O O O O 2 60 0 0 o o O O O O O O o o O O O O- O O O O O O O O O O O O O O O Q46a. Level of democracy: today O O O O O O O O O O O y=4.67+0.6*x O O 6 0 0 0 O O O O O O O O O O O O O O O 8 O O O O O O O O O O O O O 10 O O oo o O O O O O R- Linear = 0.169Frequency Histogram Dependent Variable: Trust in Government Index (higher scores=more trust) Mean = -1 27E-17 600 Std. Dev. = 1.000 N=19200 500 400 300 200 100 -3 -2 -1 0 1 2 3 Regression Standardized Residual Normal P-P Plot of Regression Standardized Residual Dependent Variable: Trust in Government Index (higher scores=more trust) 1.0 Expected Cum Prob 00 02 04 06 08 10 Observed Cum Prob
Step by Step Solution
There are 3 Steps involved in it

Get step-by-step solutions from verified subject matter experts