

Question: 1) Construct the confidence interval for the population mean u. c=0.95, x = 16.2, 6 -8.0, and n = 60 A 95% confidence interval for
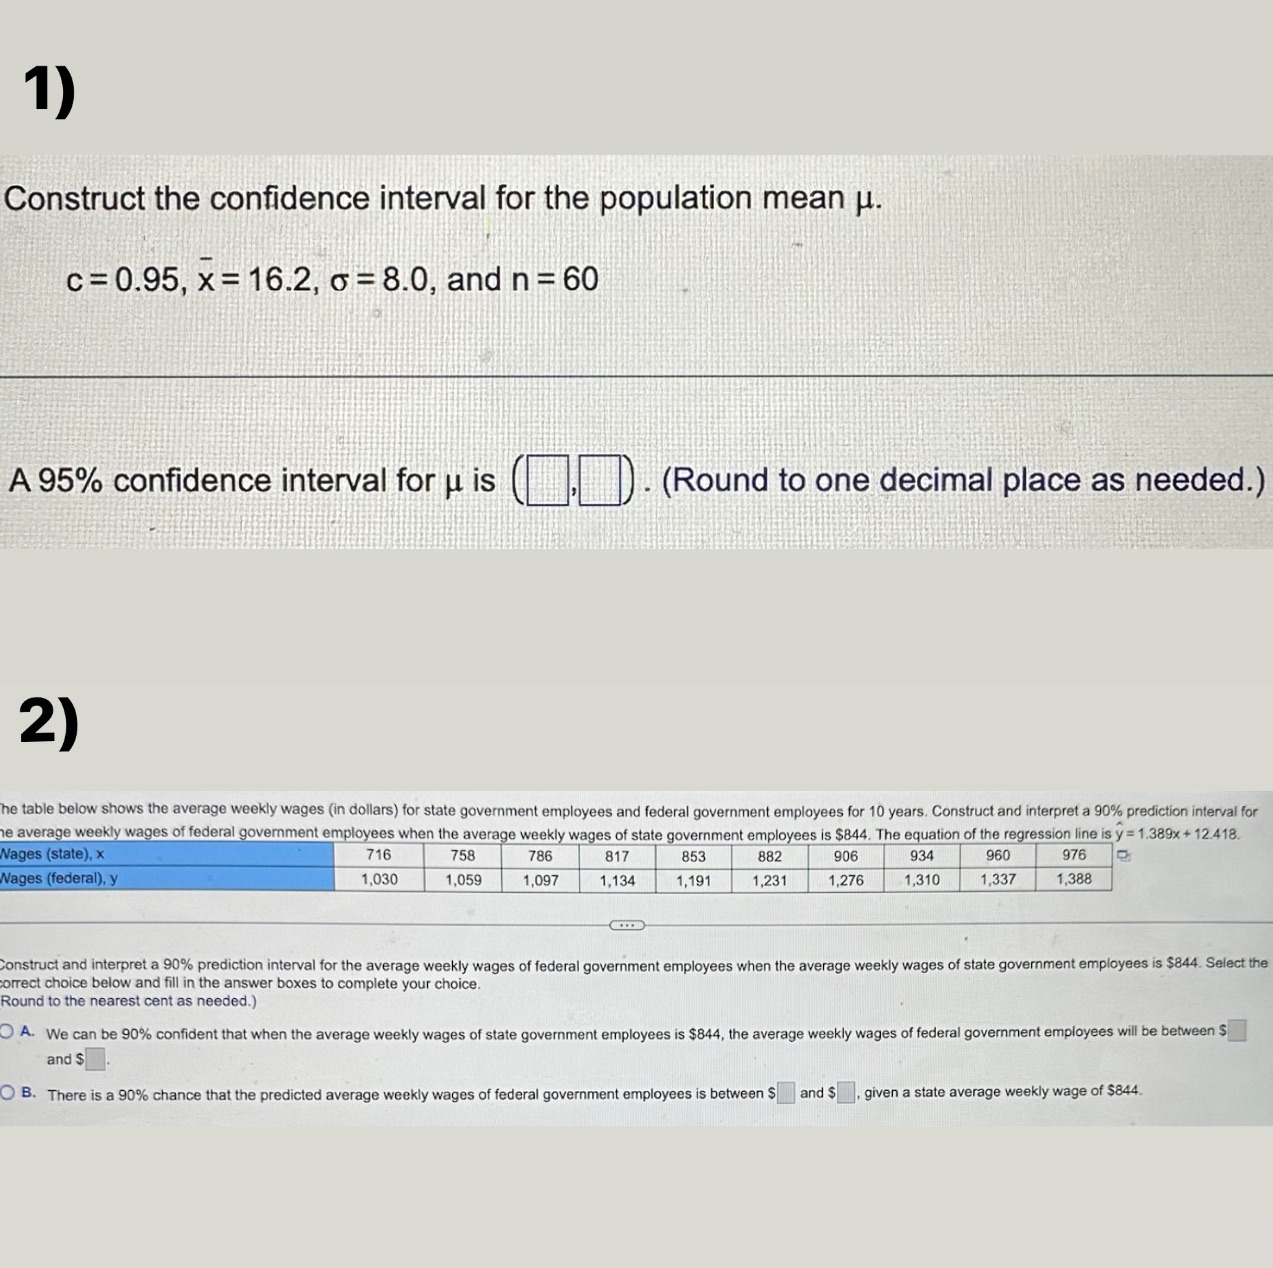
1) Construct the confidence interval for the population mean u. c=0.95, x = 16.2, 6 -8.0, and n = 60 A 95% confidence interval for u is ). (Round to one decimal place as needed.) 2) he table below shows the average weekly wages (in dollars) for state government employees and federal government employees for 10 years. Construct and interpret a 90% prediction interval for e average weekly wages of federal government employees when the average weekly wages of state government employees is $844. The equation of the regression line is y = 1.389x + 12.418. Wages (state), x 716 758 786 817 853 882 906 934 960 976 8 Wages (federal), y 1,030 1,059 1,097 1,134 1,191 1,231 1,276 1,310 1,337 1,388 Construct and interpret a 90% prediction interval for the average weekly wages of federal government employees when the average weekly wages of state government employees is $844. Select the correct choice below and fill in the answer boxes to complete your choice Round to the nearest cent as needed.) A. We can be 90% confident that when the average weekly wages of state government employees is $844, the average weekly wages of federal government employees will be between $ and $ O B. There is a 90% chance that the predicted average weekly wages of federal government employees is between $| |and $ , given a state average weekly wage of $844
Step by Step Solution
There are 3 Steps involved in it

Get step-by-step solutions from verified subject matter experts