

Question: 1. Construet and interpret a c chart using the following data: Chapter 12 - Statistically Baved Quatity Improvement for Attributes 357
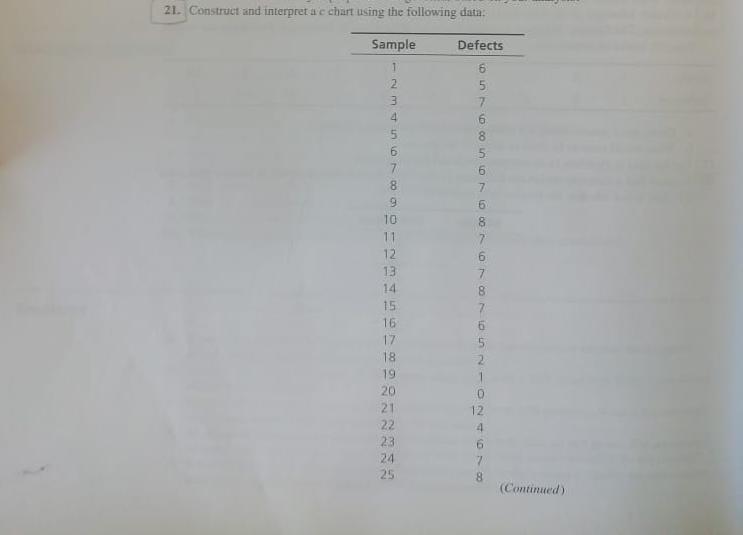
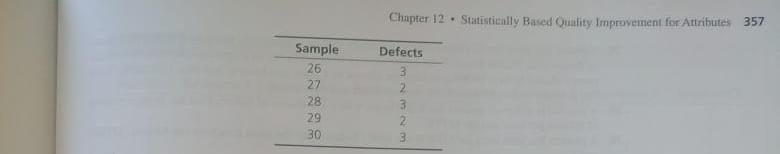
1. Construet and interpret a c chart using the following data: Chapter 12 - Statistically Baved Quatity Improvement for Attributes 357
Step by Step Solution
There are 3 Steps involved in it
1 Expert Approved Answer
Step: 1 Unlock

Question Has Been Solved by an Expert!
Get step-by-step solutions from verified subject matter experts
Step: 2 Unlock
Step: 3 Unlock