

Question: 1. Consumption and Saving Functions Suppose the following table describes the relation of consumption spending to the disposable income Disposable Income 01))... (a) Derive the
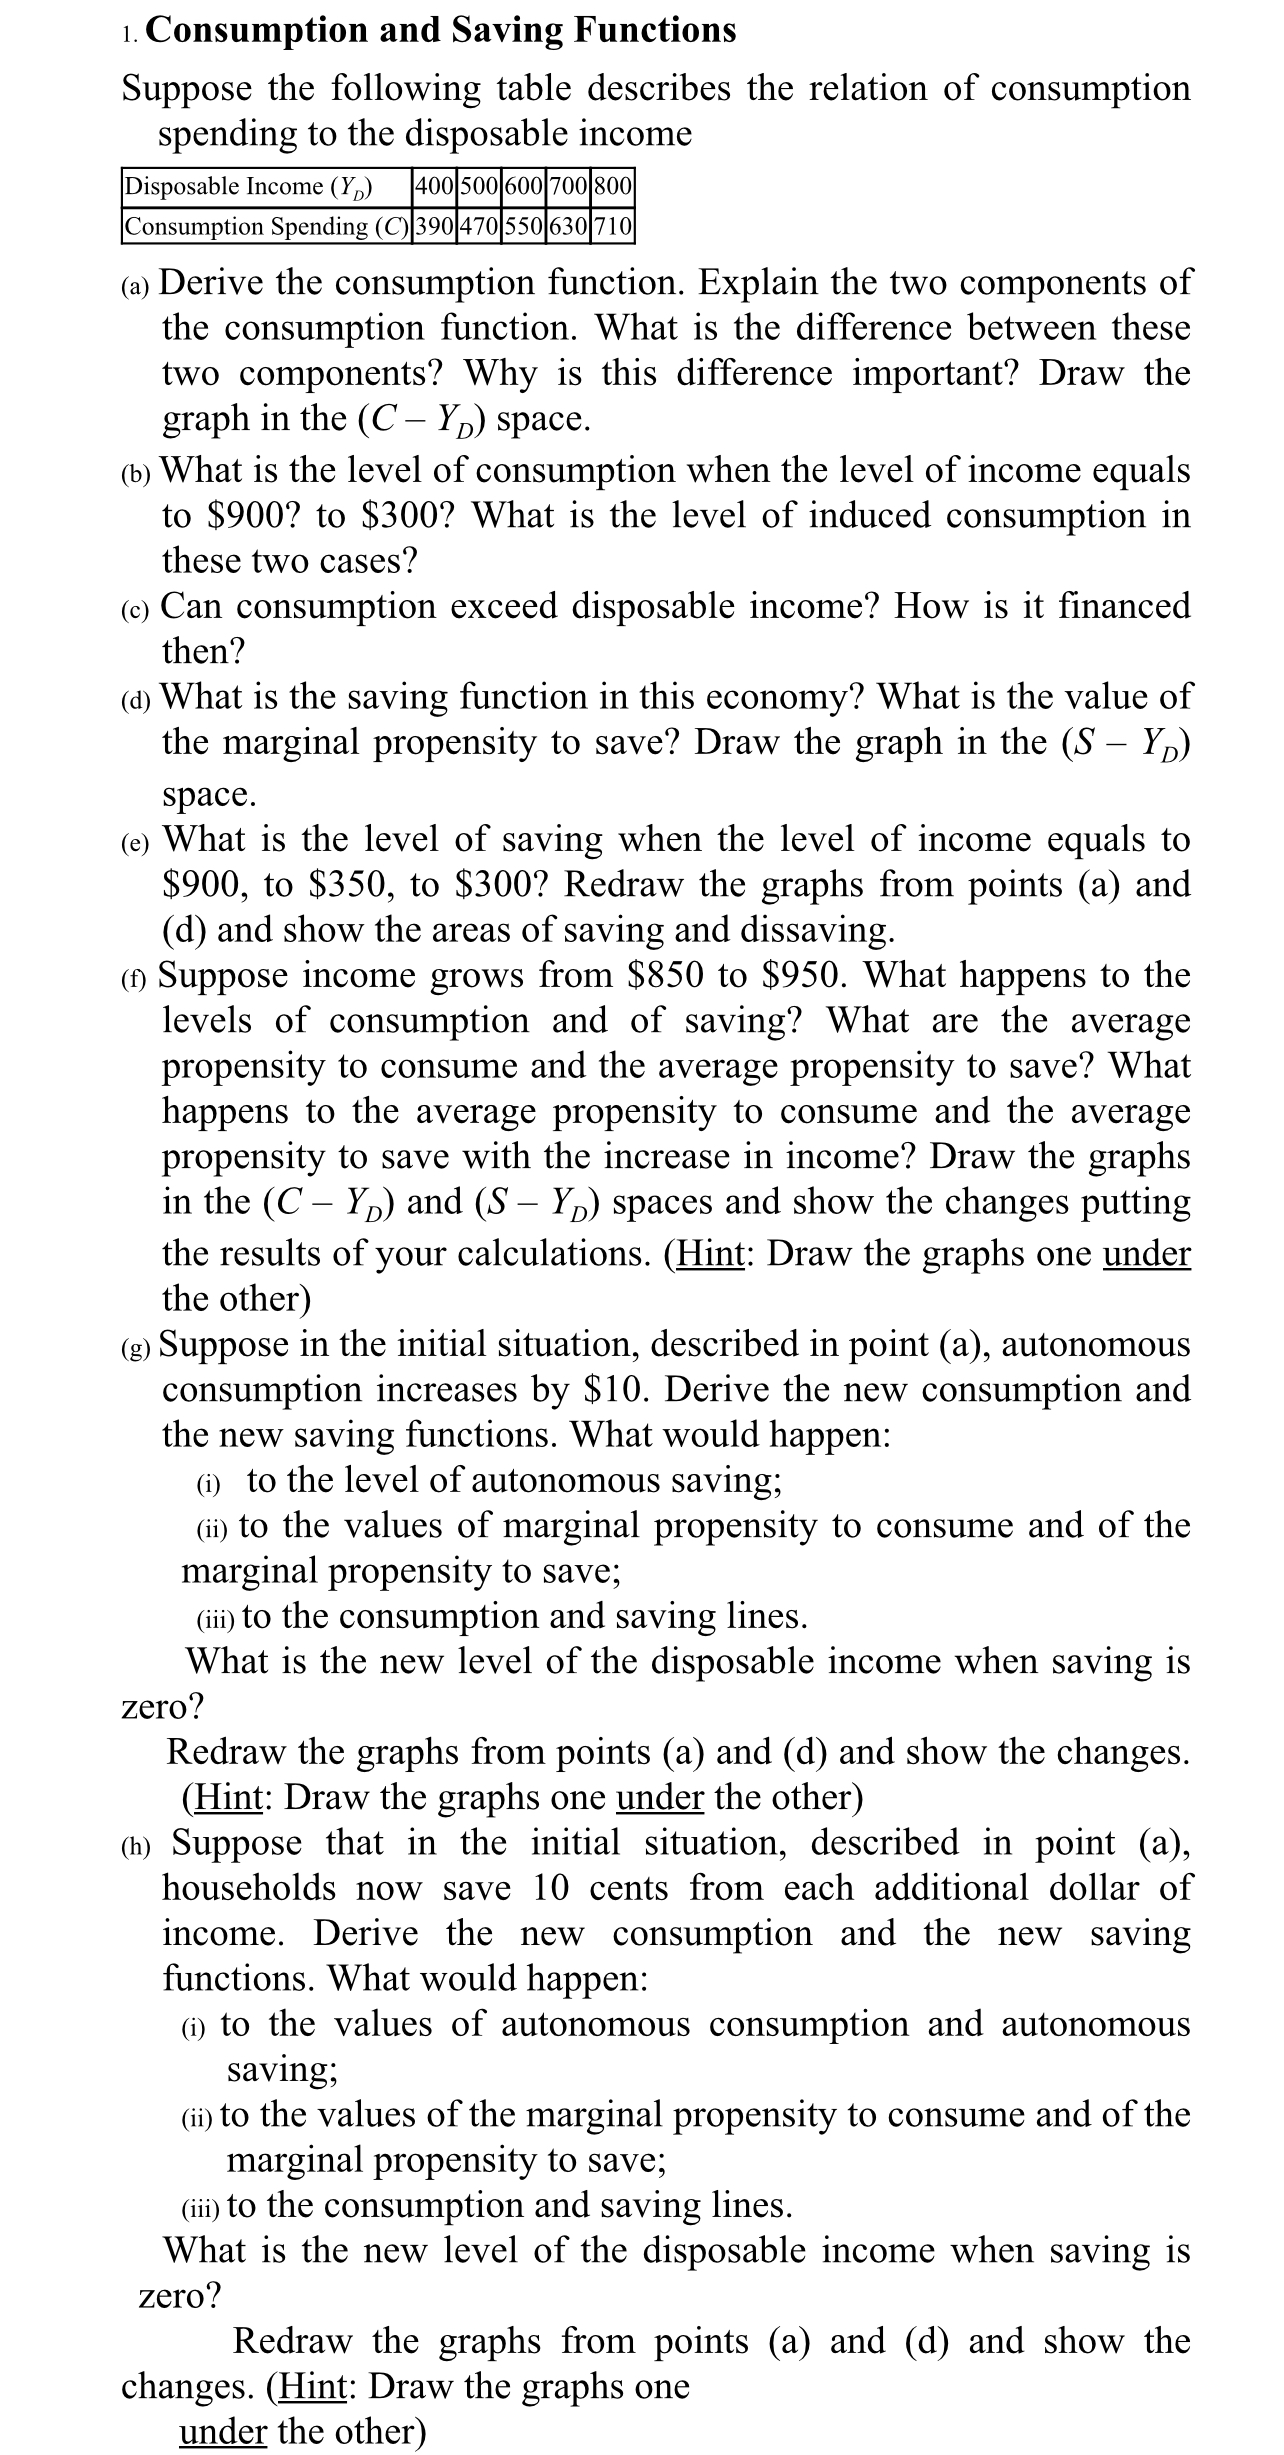

1. Consumption and Saving Functions Suppose the following table describes the relation of consumption spending to the disposable income Disposable Income 01))...\" (a) Derive the consumption function. Explain the two components of the consumption function. What is the difference between these two components? Why is this difference important? Draw the graph in the (C Y D) space. (b) What is the level of consumption when the level of income equals to $900? to $300? What is the level of induced consumption in these two cases? (c) Can consumption exceed disposable income? How is it nanced then? (d) What is the saving function in this economy? What is the value of the marginal propensity to save? Draw the graph in the (S Y D) space. (e) What is the level of saving when the level of income equals to $900, to $350, to $300? Redraw the graphs from points (a) and (d) and show the areas of saving and dissaving. (t) Suppose income grows from $850 to $950. What happens to the levels of consumption and of saving? What are the average propensity to consume and the average propensity to save? What happens to the average propensity to consume and the average propensity to save with the increase in income? Draw the graphs in the (C YD) and (S YD) spaces and show the changes putting the results of your calculations. (m: Draw the graphs one Lder the other) (g) Suppose in the initial situation, described in point (a), autonomous consumption increases by $10. Derive the new consumption and the new saving functions. What would happen: (i) to the level of autonomous saving; (ii) to the values of marginal propensity to consume and of the marginal propensity to save; (iii) to the consumption and saving lines. What is the new level of the disposable income when saving is zero? Redraw the graphs from points (a) and (d) and show the changes. (m: Draw the graphs one Lder the other) (h) Suppose that in the initial situation, described in point (a), households now save 10 cents from each additional dollar of income. Derive the new consumption and the new saving functions. What would happen: (i) to the values of autonomous consumption and autonomous saving; (ii) to the values of the marginal propensity to consume and of the marginal propensity to save; (iii) to the consumption and saving lines. What is the new level of the disposable income when saving is zero? Redraw the graphs from points (a) and (d) and Show the changes. (m: Draw the graphs one Lder the other)
Step by Step Solution
There are 3 Steps involved in it

Get step-by-step solutions from verified subject matter experts