

Question: 1 . Control Charts ( 5 points ) Aspen Plastics produces plastic bottles to customer order. The quality inspector randomly selects four bottles from the
Control Charts points
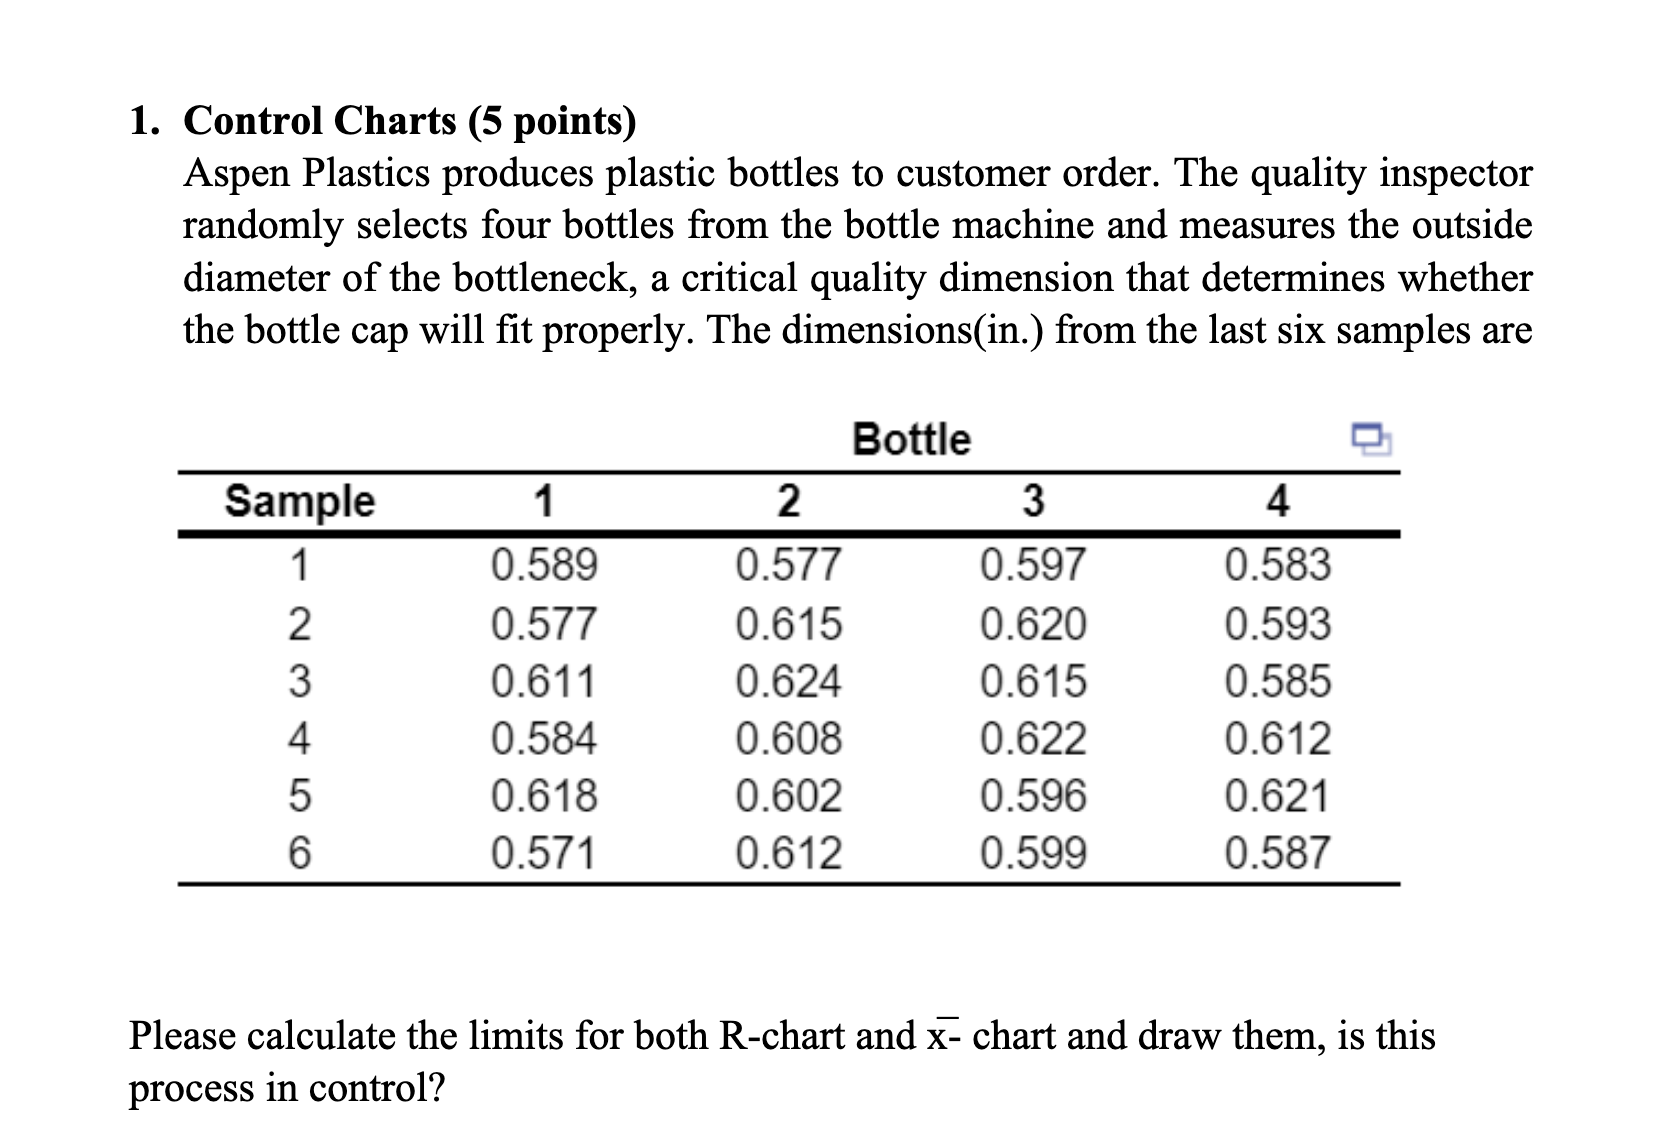
Aspen Plastics produces plastic bottles to customer order. The quality inspector randomly selects four bottles from the bottle machine and measures the outside diameter of the bottleneck, a critical quality dimension that determines whether the bottle cap will fit properly. The dimensionsin from the last six samples are
begintabularccccc
multicolumnc Bottle
hline Sample & mathbf & mathbf & mathbf & mathbf
hline & & & &
& & & &
& & & &
& & & &
& & & &
& & & &
hline
endtabular
Please calculate the limits for both Rchart and overlinemathrmx chart and draw them, is this process in control?
Step by Step Solution
There are 3 Steps involved in it
1 Expert Approved Answer
Step: 1 Unlock

Question Has Been Solved by an Expert!
Get step-by-step solutions from verified subject matter experts
Step: 2 Unlock
Step: 3 Unlock