

Question: 1 . Create a data frame from the following information begin { tabular } { | l | r | r | r |
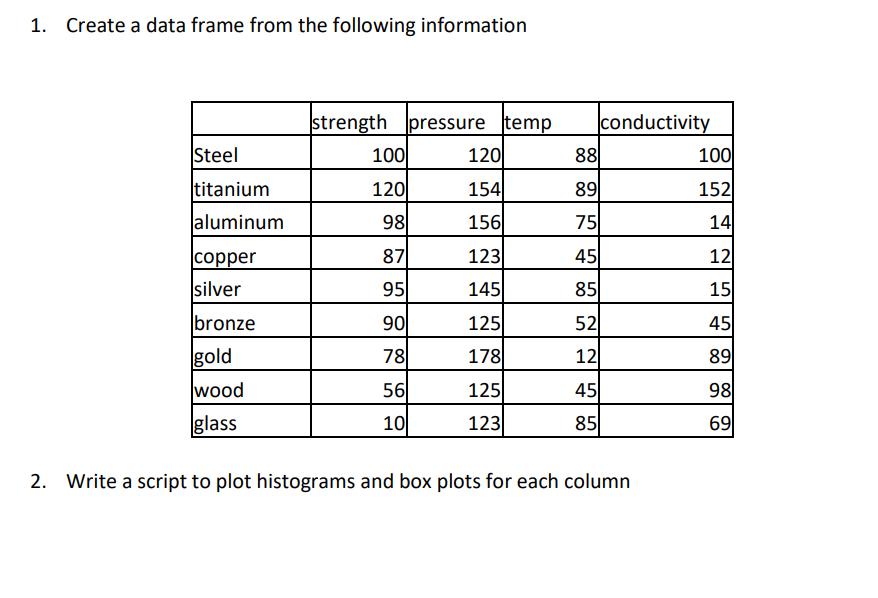
Create a data frame from the following information
begintabularlrrrr
hline & strength & pressure & temp & multicolumnl conductivity
hline Steel & & & &
hline titanium & & & &
hline aluminum & & & &
hline copper & & & &
hline silver & & & &
hline bronze & & & &
hline gold & & & &
hline wood & & & &
hline glass & & & &
hline
endtabular
Write a script to plot histograms and box plots for each column
Step by Step Solution
There are 3 Steps involved in it
1 Expert Approved Answer
Step: 1 Unlock

Question Has Been Solved by an Expert!
Get step-by-step solutions from verified subject matter experts
Step: 2 Unlock
Step: 3 Unlock