

Question: 1. Create a demand graph using the following table of values: PRICE QUANTITY 500 10 20 450 30 400 40 350 50 300 60
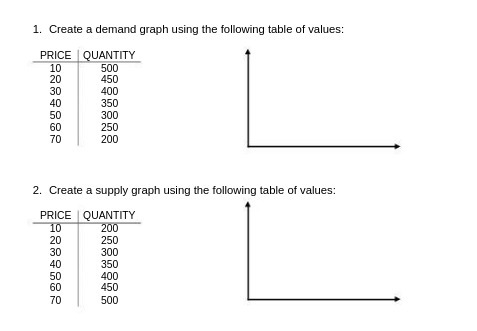
1. Create a demand graph using the following table of values: PRICE QUANTITY 500 10 20 450 30 400 40 350 50 300 60 250 70 200 2. Create a supply graph using the following table of values: PRICE QUANTITY 200 10 20 250 30 300 40 350 50 400 60 450 70 500
Step by Step Solution
There are 3 Steps involved in it
1 Expert Approved Answer
Step: 1 Unlock

Answer The demand and supply graphs have been created using the p... View full answer
Question Has Been Solved by an Expert!
Get step-by-step solutions from verified subject matter experts
Step: 2 Unlock
Step: 3 Unlock