

Question: 1. Create a flow chart that shows the decision flow for the table below 2. Come up with an appropriate set of test cases (write
1. Create a flow chart that shows the decision flow for the table below
2. Come up with an appropriate set of test cases (write the down) and test your flowchart
3. Write your java code based on your flow chart
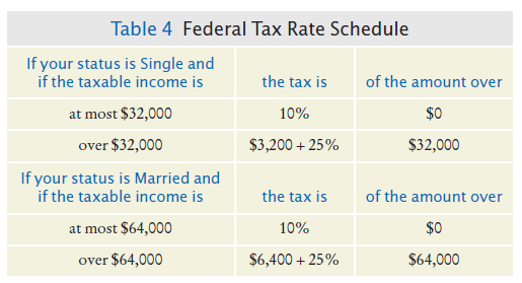
Table 4 Federal Tax Rate Schedule If your status is Single and if the taxable income is the tax is of the amount over at most $32,000 10% $0 over $32,000 $3,200 + 25% $32,000 If your status is Married and if the taxable income is the tax is of the amount over at most $64,000 10% $0 over $64,000 $6,400 + 25% $64,000
Step by Step Solution
There are 3 Steps involved in it
1 Expert Approved Answer
Step: 1 Unlock

Question Has Been Solved by an Expert!
Get step-by-step solutions from verified subject matter experts
Step: 2 Unlock
Step: 3 Unlock