

Question: 1 . Create a line graph that shows sales by month for each appetizer. This is one graph with all the appetizers shown with their
Create a line graph that shows sales by month for each appetizer. This is one graph with all the appetizers shown with their own line. Months in calendar order should be on the horizontal axis and sales on the vertical axis. Each month should only appear once on the horizontal axis. Be sure to label both the axis, and give the graph a title and a legend.
If Charlies was going to sell two appetizers together as a combo, using Correlation Analysis, which two would make the most sense and why? Show the analysis that leads you to this conclusion.
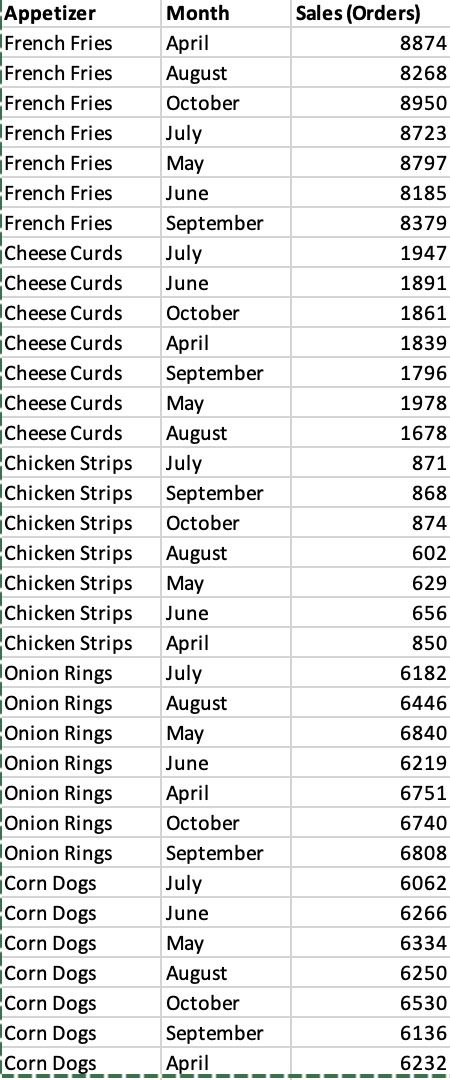
Appetizer Month Sales Orders French Fries April French Fries August French Fries October French Fries July French Fries May French Fries June French Fries September Cheese Curds July Cheese Curds June Cheese Curds October Cheese Curds April Cheese Curds September Cheese Curds May Cheese Curds August Chicken Strips July Chicken Strips September Chicken Strips October Chicken Strips August Chicken Strips May Chicken Strips June Chicken Strips April Onion Rings July Onion Rings August Onion Rings May Onion Rings June Onion Rings April Onion Rings October Onion Rings September Corn Dogs July Corn Dogs June Corn Dogs May Corn Dogs August Corn Dogs October Corn Dogs September Corn Dogs April
Step by Step Solution
There are 3 Steps involved in it
1 Expert Approved Answer
Step: 1 Unlock

Question Has Been Solved by an Expert!
Get step-by-step solutions from verified subject matter experts
Step: 2 Unlock
Step: 3 Unlock