

Question: 1. Create a scatter plot for demand data and forecasting. What can you conclude from the graph! 2. Calculate MFE, MAD, and Tracking Signal. Explain
1. Create a scatter plot for demand data and forecasting. What can you conclude from the graph! 2. Calculate MFE, MAD, and Tracking Signal. Explain the meaning!
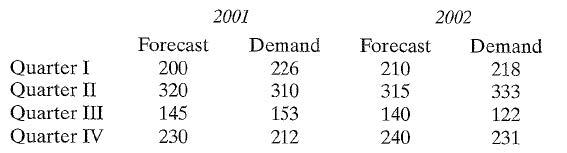
Quarter I Quarter II Quarter III Quarter IV 2001 Forecast Demand 200 226 320 310 145 153 230 212 2002 Forecast Demand 210 218 315 333 140 122 240 231Step by Step Solution
There are 3 Steps involved in it
1 Expert Approved Answer
Step: 1 Unlock

Question Has Been Solved by an Expert!
Get step-by-step solutions from verified subject matter experts
Step: 2 Unlock
Step: 3 Unlock