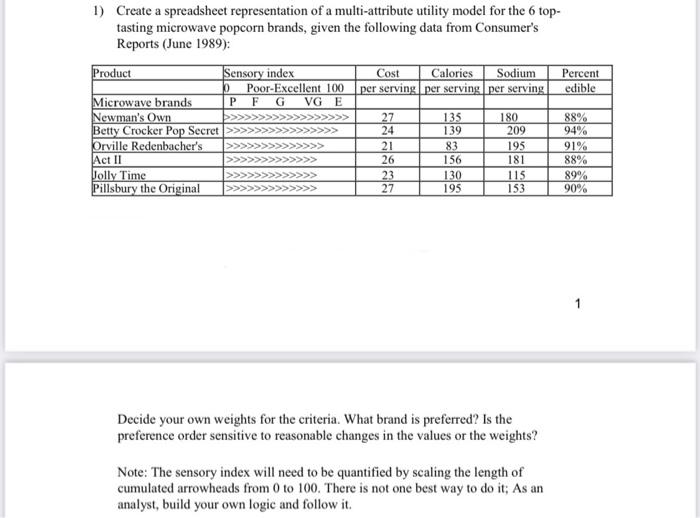
Question: 1) Create a spreadsheet representation of a multi-attribute utility model for the 6 top- tasting microwave popcorn brands, given the following data from Consumer's Reports

1) Create a spreadsheet representation of a
1) Create a spreadsheet representation of a multi-attribute utility model for the 6 top- tasting microwave popcorn brands, given the following data from Consumer's Reports (June 1989): Product Sensory index Cost Calories Sodium Percent Poor-Excellent 100 per serving per serving per serving edible Microwave brands PF G VG E Newman's Own 27 135 180 88% Betty Crocker Pop Secret >>>>> 24 139 209 94% Orville Redenbacher's 21 83 195 91% Act II 26 156 181 88% Jolly Time 23 130 115 89% Pillsbury the Original 195 153 90% P> 27 1 Decide your own weights for the criteria. What brand is preferred? Is the preference order sensitive to reasonable changes in the values or the weights? Note: The sensory index will need to be quantified by scaling the length of cumulated arrowheads from 0 to 100. There is not one best way to do it; As an analyst, build your own logic and follow it

Step by Step Solution

There are 3 Steps involved in it

1 Expert Approved Answer
Step: 1 Unlock blur-text-image
Question Has Been Solved by an Expert!

Get step-by-step solutions from verified subject matter experts

Step: 2 Unlock
Step: 3 Unlock

Students Have Also Explored These Related General Management Questions!