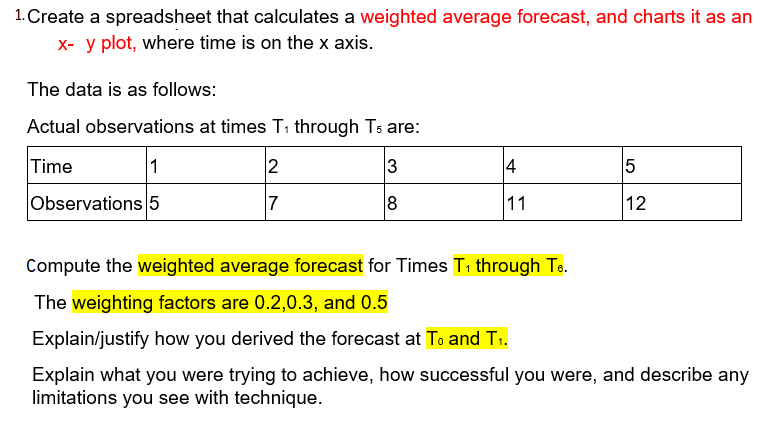
Question: 1. Create a spreadsheet that calculates a weighted average forecast, and charts it as an X- y plot, where time is on the x axis.

1. Create a spreadsheet that calculates a

1. Create a spreadsheet that calculates a weighted average forecast, and charts it as an X- y plot, where time is on the x axis. The data is as follows: Actual observations at times T1 through To are: Time 1 2 3 4 5 Observations 5 7 8 11 12 Compute the weighted average forecast for Times T1 through Te. The weighting factors are 0.2,0.3, and 0.5 Explain/justify how you derived the forecast at To and T1. Explain what you were trying to achieve, how successful you were, and describe any limitations you see with technique

Step by Step Solution

There are 3 Steps involved in it

1 Expert Approved Answer
Step: 1 Unlock blur-text-image
Question Has Been Solved by an Expert!

Get step-by-step solutions from verified subject matter experts

Step: 2 Unlock
Step: 3 Unlock

Students Have Also Explored These Related General Management Questions!