

Question: - 1. Create a statistical summary of the data in the file CommuteSt Louis.csv. Plot a histogram of age for the CommuteStLouis data. Age Distance
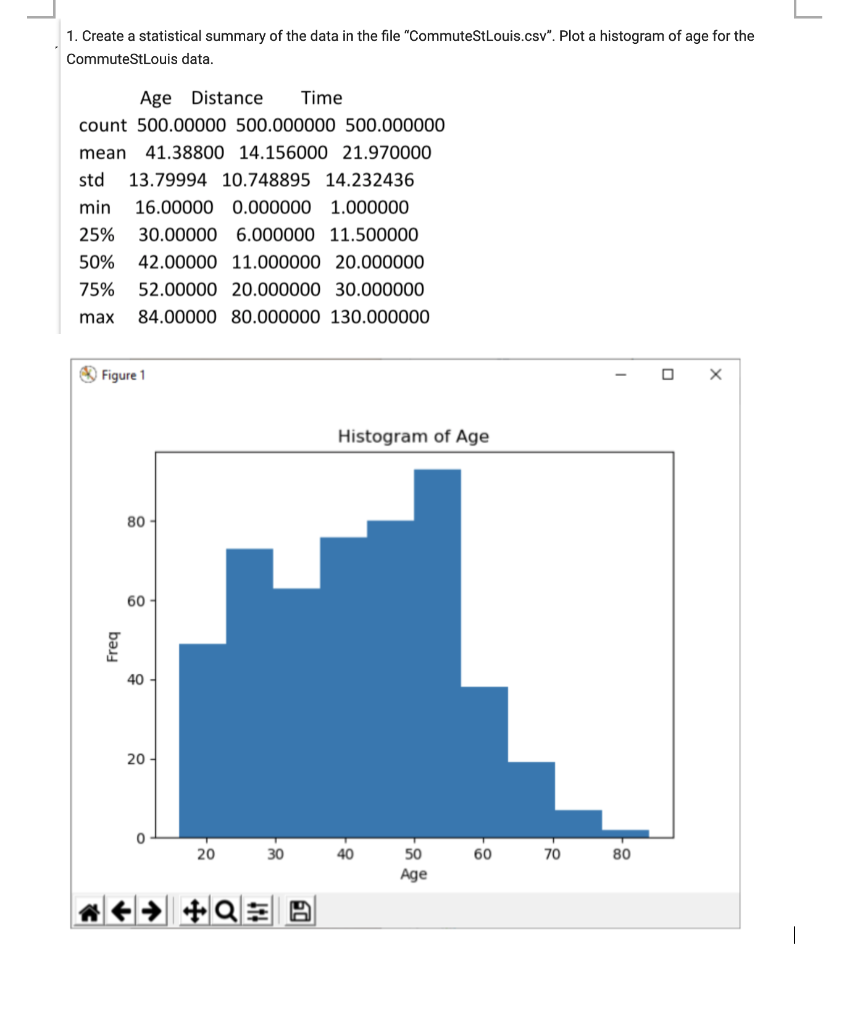
- 1. Create a statistical summary of the data in the file "CommuteSt Louis.csv". Plot a histogram of age for the CommuteStLouis data. Age Distance Time count 500.00000 500.000000 500.000000 mean 41.38800 14.156000 21.970000 std 13.79994 10.748895 14.232436 min 16.00000 0.000000 1.000000 25% 30.00000 6.000000 11.500000 50% 42.00000 11.000000 20.000000 75% 52.00000 20.000000 30.000000 max 84.00000 80.000000 130.000000 Figure 1 Histogram of Age 80 60 Freq 40 20 0 20 30 40 50 60 70 80 Age
Step by Step Solution
There are 3 Steps involved in it
1 Expert Approved Answer
Step: 1 Unlock

Question Has Been Solved by an Expert!
Get step-by-step solutions from verified subject matter experts
Step: 2 Unlock
Step: 3 Unlock