

Question: 1. Create a stemplot of the data. 2, How high would the gate need to be so that 95% of the dogs (23 out of
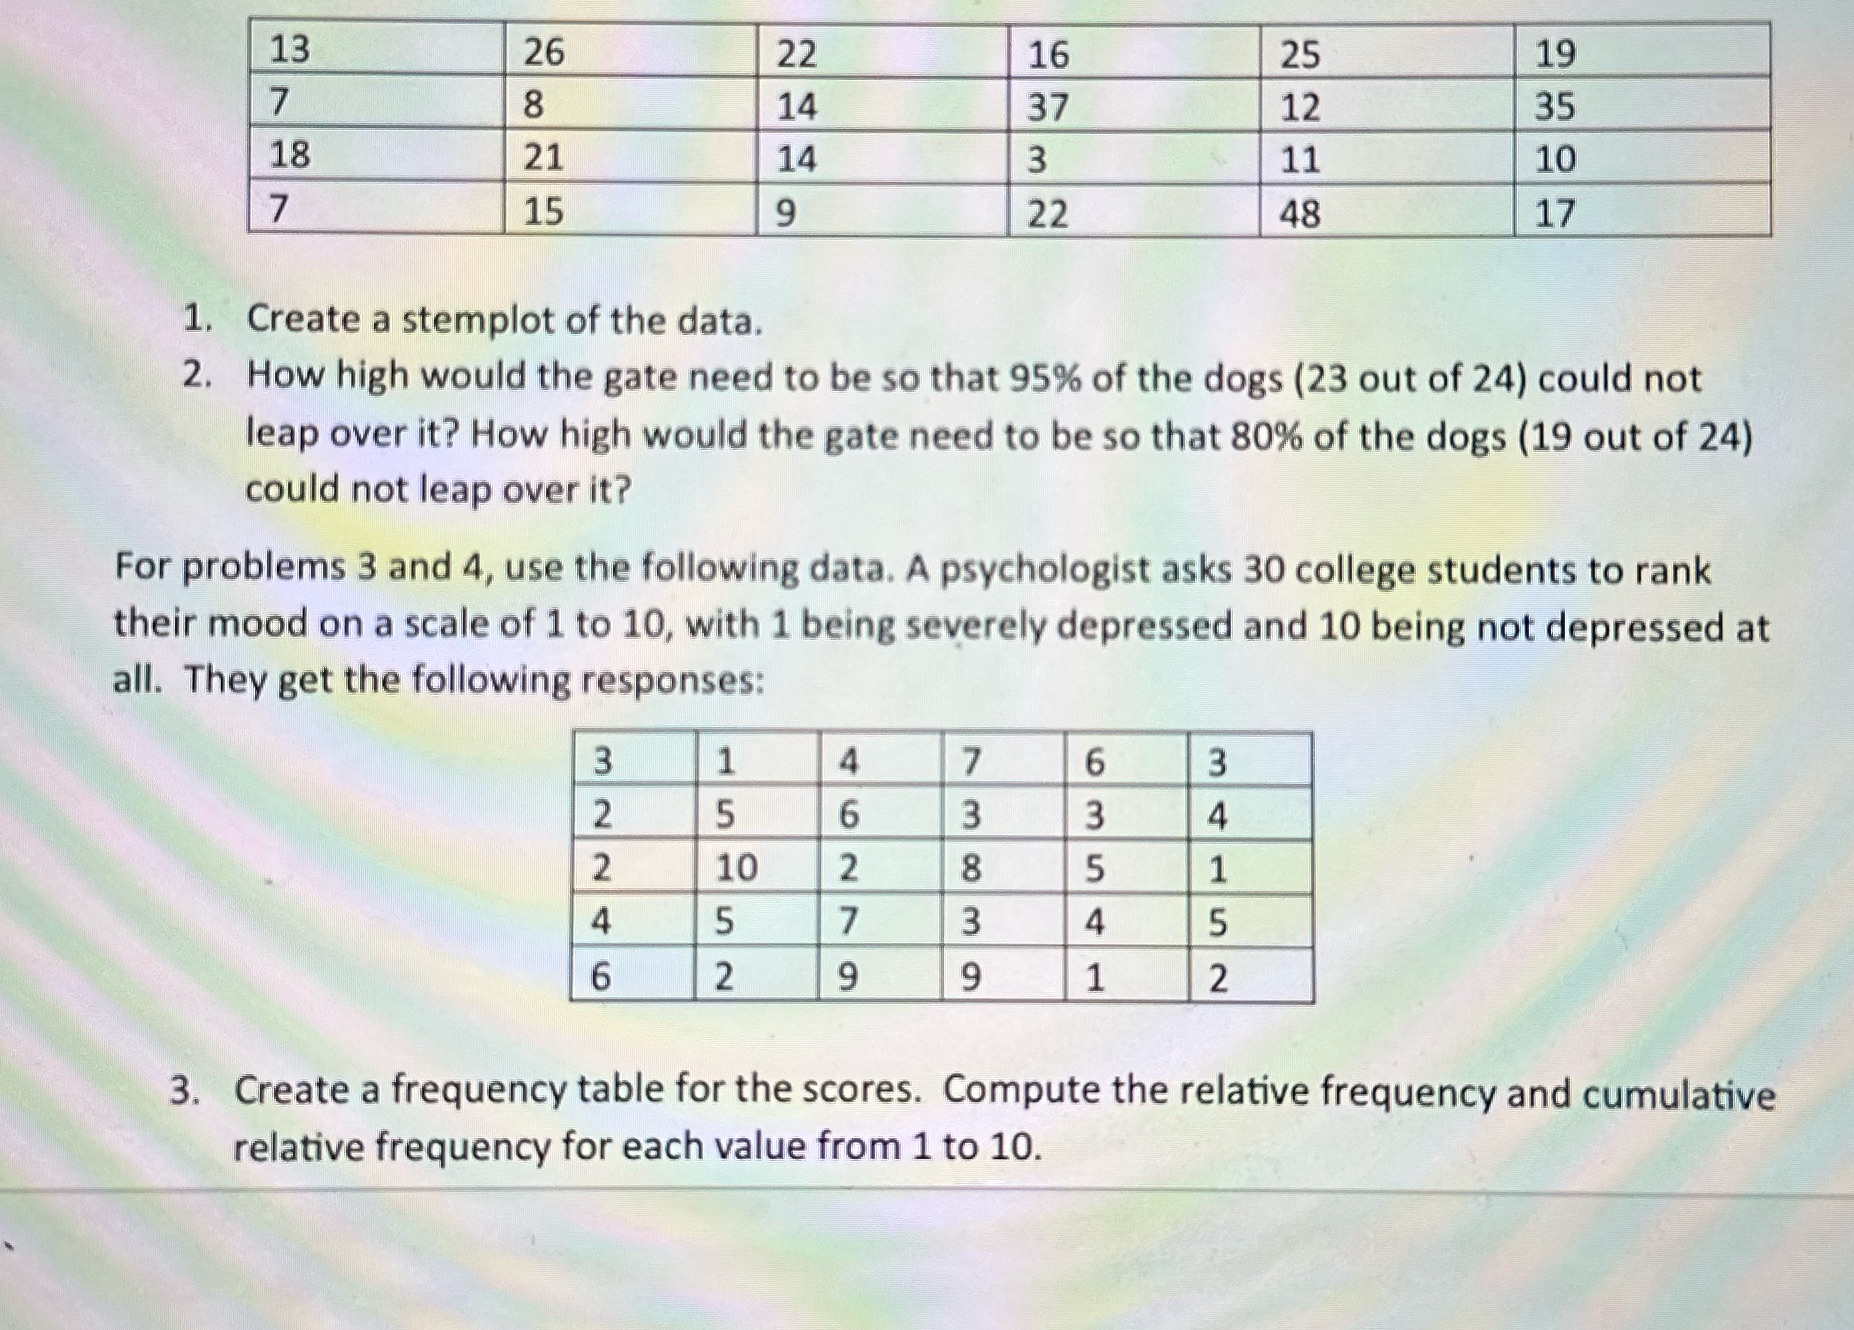
1. Create a stemplot of the data. 2, How high would the gate need to be so that 95% of the dogs (23 out of 24) could not leap over it? How high would the gate need to be so that 80% of the dogs (19 out of 24) could not leap over it? For problems 3 and 4, use the following data. A psychologist asks 30 college students to rank their mood on a scale of 1 to 10, with 1 being severely depressed and 10 being not depressed at all. They get the following responses: 3. Create a frequency table for the scores. Compute the relative frequency and cumulative relative frequency for each value from 1 to 10
Step by Step Solution
There are 3 Steps involved in it
1 Expert Approved Answer
Step: 1 Unlock

Question Has Been Solved by an Expert!
Get step-by-step solutions from verified subject matter experts
Step: 2 Unlock
Step: 3 Unlock