

Question: 1) Create a table tracking the stock prices and then plot (graph) the price of the shares on the last day of each month for
1) Create a table tracking the stock prices and then plot (graph) the price of the shares on the last day of each month for 3 years leading up to May 31, 2020
2) Using the last three annual financial statements analyzed Rogers and RBC stocks.
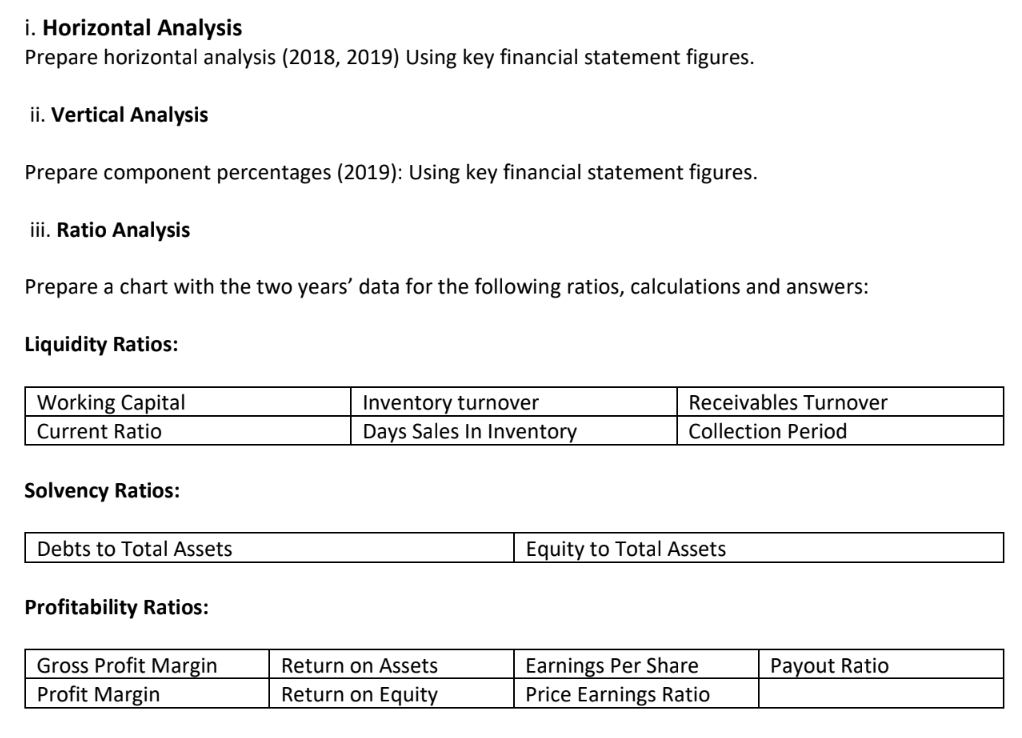
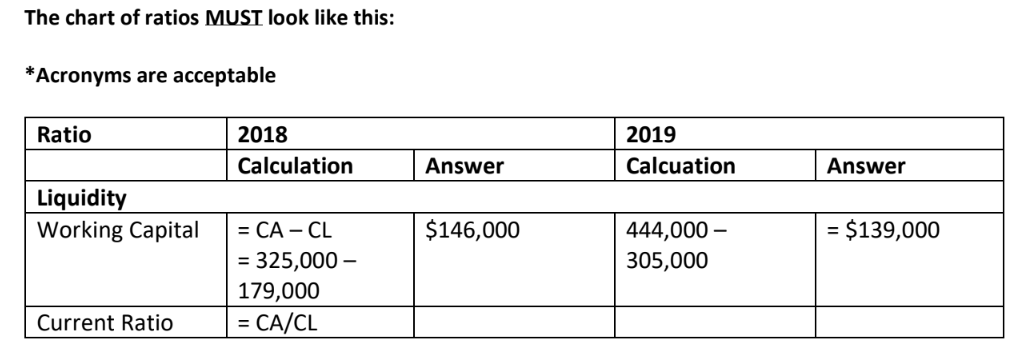
i. Horizontal Analysis Prepare horizontal analysis (2018, 2019) Using key financial statement figures. ii. Vertical Analysis Prepare component percentages (2019): Using key financial statement figures. iii. Ratio Analysis Prepare a chart with the two years' data for the following ratios, calculations and answers: Liquidity Ratios: Working Capital Current Ratio Inventory turnover Days Sales In Inventory Receivables Turnover Collection Period Solvency Ratios: Debts to Total Assets Equity to Total Assets Profitability Ratios: Gross Profit Margin Profit Margin Payout Ratio Return on Assets Return on Equity Earnings Per Share Price Earnings Ratio The chart of ratios MUST look like this: *Acronyms are acceptable Ratio 2018 Calculation 2019 Calcuation Answer Answer Liquidity Working Capital $146,000 = $139,000 444,000 - 305,000 = CA - CL = 325,000 - 179,000 = CA/CL Current Ratio i. Horizontal Analysis Prepare horizontal analysis (2018, 2019) Using key financial statement figures. ii. Vertical Analysis Prepare component percentages (2019): Using key financial statement figures. iii. Ratio Analysis Prepare a chart with the two years' data for the following ratios, calculations and answers: Liquidity Ratios: Working Capital Current Ratio Inventory turnover Days Sales In Inventory Receivables Turnover Collection Period Solvency Ratios: Debts to Total Assets Equity to Total Assets Profitability Ratios: Gross Profit Margin Profit Margin Payout Ratio Return on Assets Return on Equity Earnings Per Share Price Earnings Ratio The chart of ratios MUST look like this: *Acronyms are acceptable Ratio 2018 Calculation 2019 Calcuation Answer Answer Liquidity Working Capital $146,000 = $139,000 444,000 - 305,000 = CA - CL = 325,000 - 179,000 = CA/CL Current Ratio
Step by Step Solution
There are 3 Steps involved in it

Get step-by-step solutions from verified subject matter experts