

Question: 1. Create possible data and sketch a continnous graph to illustrate a situation in which a city's population is increasing slower and slower until it
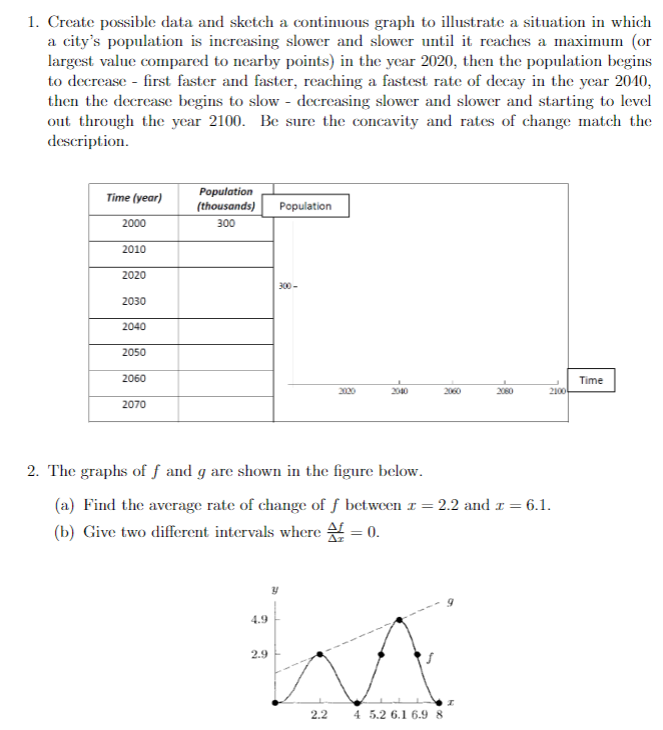
1. Create possible data and sketch a continnous graph to illustrate a situation in which a city's population is increasing slower and slower until it reaches a maximum (or largest value compared to nearby points) in the year 2020, then the population begins to decrease - first faster and faster, reaching a fastest rate of decay in the year 2040, then the decrease begins to slow - decreasing slower and slower and starting to level out through the year 2100. Be sure the concavity and rates of change match the deseription. 2. The graphs of [ and g are shown in the figure below. {a) Find the average rate of change of f between x =2.2 and z = 6.1. (b) Give two different intervals where 2L = 0. _ x 22 4 526169 8
Step by Step Solution
There are 3 Steps involved in it

Get step-by-step solutions from verified subject matter experts