

Question: 1. Create the 2005 Income Statement, Balance Sheet and Statement of Retained Earnings on Excel Use the format shown in class (see Zoom recordings). Put
1. Create the 2005 Income Statement, Balance Sheet and Statement of Retained Earnings on Excel Use the format shown in class (see Zoom recordings). Put data on upper left corner of the Excel sheet All financial statements created must be linked by formulas
2. Evaluate the firms performance using ratio analysis.
Deliverables: 1. One Excel file with the financial statements and ratio calculations 2. WORD documents with the ratio Note: Complete the table below and expand accordingly.
| Ratio Analysis: Complete the chart using the attached data and Financial Statements | |||||
| Main Ratio Categories | Explanation | Example(s) | Interpretation | Industry Average | Analysis & Recommendations. Discuss two departments that could address the problem (if any) and explain how. |
| Liquidity Ratios |
| 1.Current Ratio:
2. Quick Ratio |
| 6x
5x |
|
| Debt Management Ratios |
| TIE
|
| 6.2% |
|
| Asset Management Ratios |
| DSO
DSI
|
|
25 days
30 days
|
|
| Profit Ratios |
| 1.PM
2.ROE
3. ROA
|
| 6%
18.2%
9.1% |
|
| Market Ratios |
| Market-to-Book (M/B)
|
| .2.5x |
|
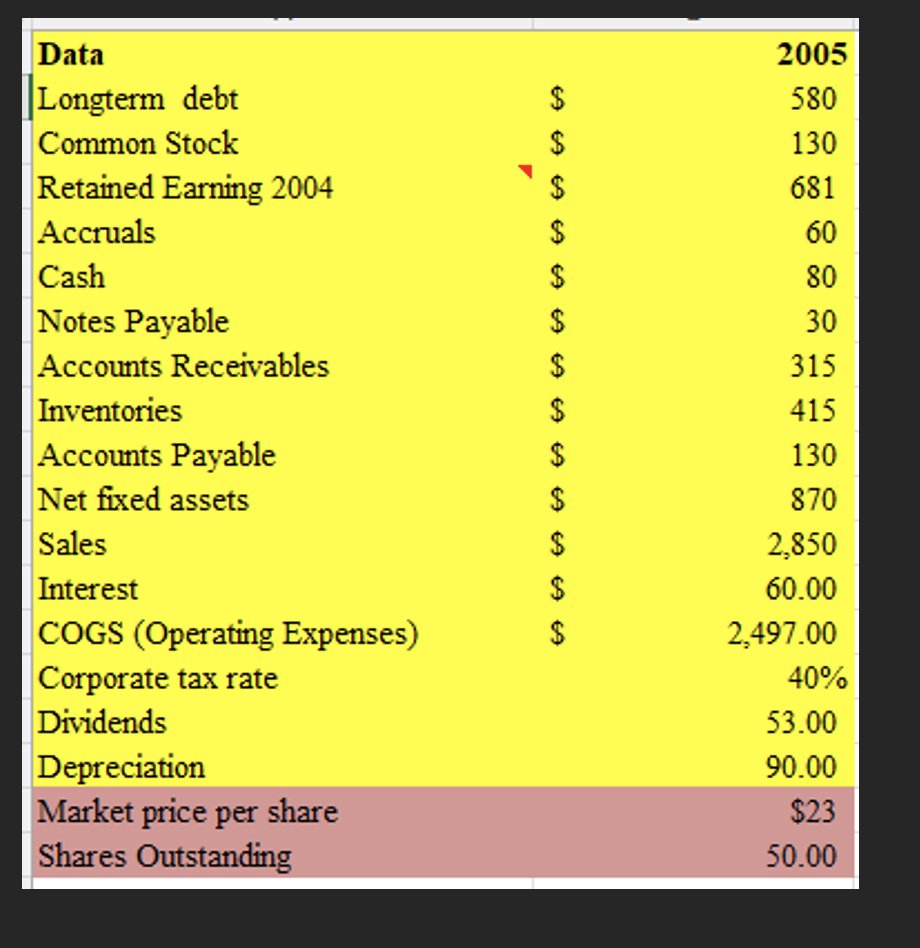
DataLongtermdebtCommonStockRetainedEarning2004AccrualsCashNotesPayableAccountsReceivablesInventoriesAccountsPayableNetfixedassetsSalesInterestCOGS(OperatingExpenses)CorporatetaxrateDividendsDepreciationMarketpricepershareSharesOutstanding$$$$$$$$$$$$$20055801306816080303154151308702,85060.00$2353.0090.0050.00
Step by Step Solution
There are 3 Steps involved in it

Get step-by-step solutions from verified subject matter experts