Question: 1. create the 2022 Budget for BRSB activities using a financial model that you have created. Refer to the Monthly 2021 tab in the appendix
1. create the 2022 Budget for BRSB activities using a financial model that you have created. Refer to the Monthly 2021 tab in the appendix as the template to use for the 2022 Budget.
2. Your Director also wants to understand which of the 4 tiers brings the most added-value to Bell. One key metric that must be determined is Average Revenue per Unit (ARPU); however, your director leaves you with the flexibility to encompass other useful metrics in your analysis. In addition to quantitative analysis, consider the qualitative factors that might affect your recommendation.
3. Please give a summary of your findings for sections A) and B) above using Powerpoint (max 2 pages) to discuss your analysis.
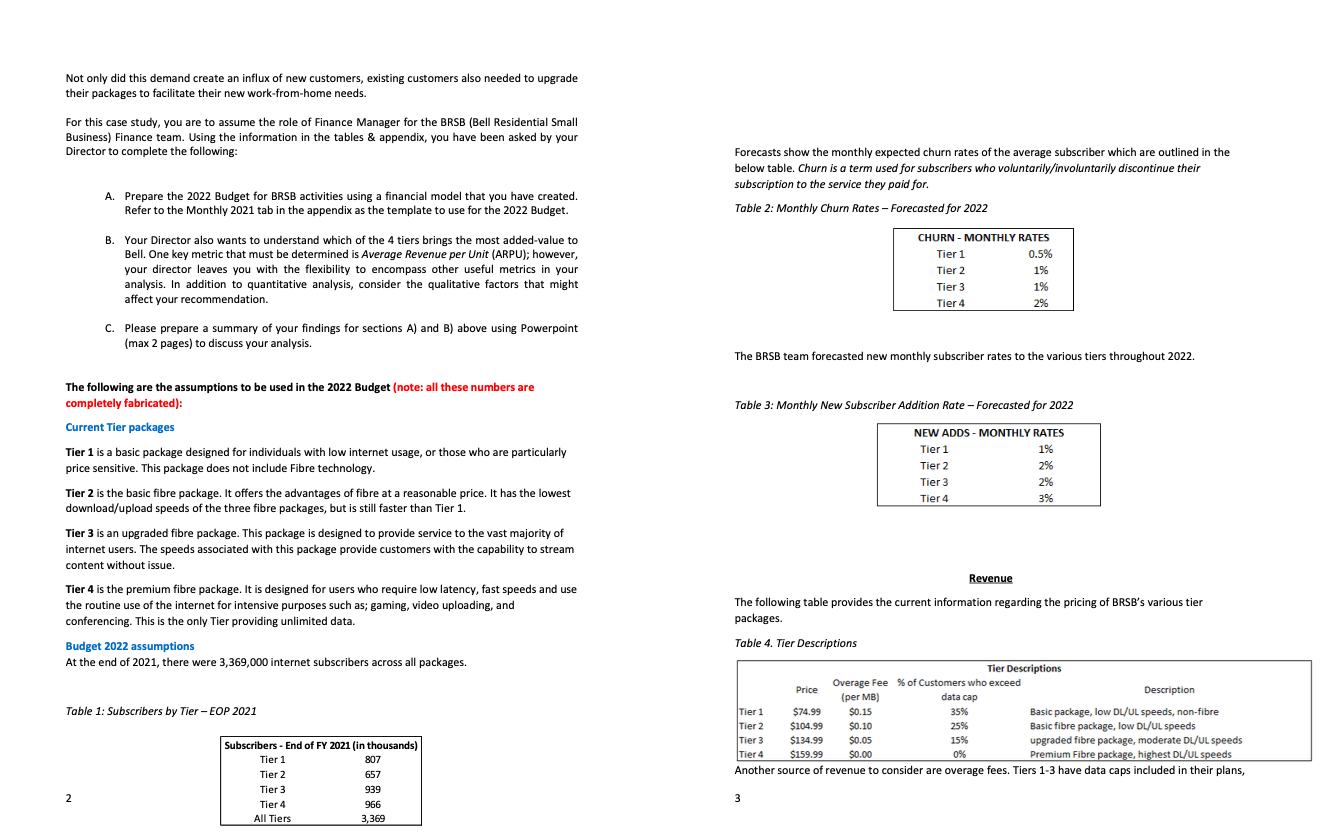
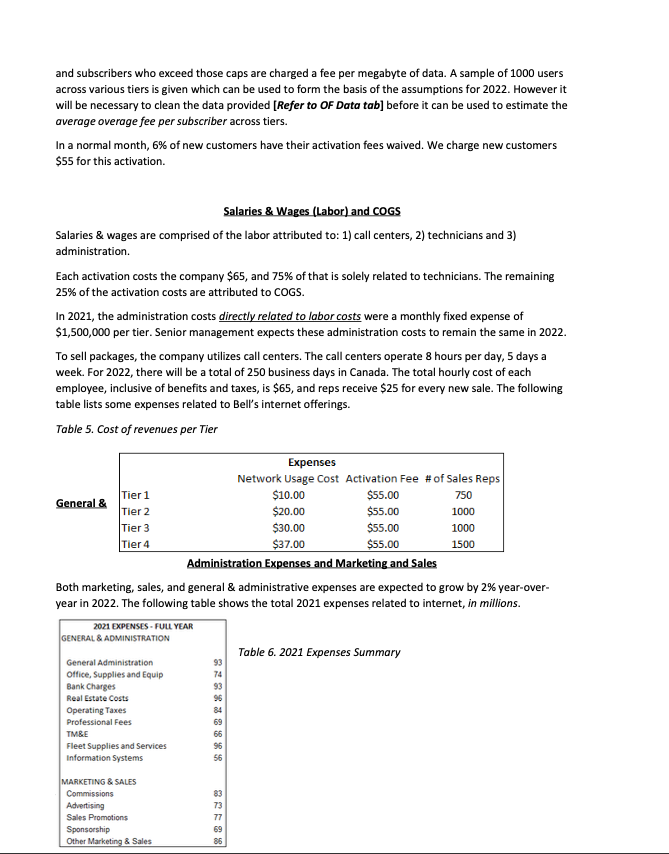
Not only did this demand create an influx of new customers, existing customers also needed to upgrade their packages to facilitate their new work-from-home needs For this case study, you are to assume the role of Finance Manager for the BRSB (Bell Residential Small Business) Finance team. Using the information in the tables & appendix, you have been asked by your Director to complete the following: Forecasts show the monthly expected churn rates of the average subscriber which are outlined in the below table. Churn is a term used for subscribers who voluntarily/involuntarily discontinue their subscription to the service they paid for. A. Prepare the 2022 Budget for BRSB activities using a financial model that you have created. Refer to the Monthly 2021 tab in the appendix as the template to use for the 2022 Budget. Table 2: Monthly Churn Rates - Forecasted for 2022 . Your Director also wants to understand which of the 4 tiers brings the most added-value to CHURN - MONTHLY RATES Bell. One key metric that must be determined is Average Revenue per Unit (ARPU); however, Tier 1 0.5% your director leaves you with the flexibility to encompass other useful metrics in your Tier 2 1% analysis. In addition to quantitative analysis, consider the qualitative factors that might Tier 3 1% affect your recommendation. Tier 4 2% C. Please prepare a summary of your findings for sections A) and B) above using Powerpoint (max 2 pages) to discuss your analysis. The BRSB team forecasted new monthly subscriber rates to the various tiers throughout 2022. The following are the assumptions to be used in the 2022 Budget (note: all these numbers are completely fabricated): Table 3: Monthly New Subscriber Addition Rate - Forecasted for 2022 Current Tier packages NEW ADDS - MONTHLY RATES Tier 1 is a basic package designed for individuals with low internet usage, or those who are particularly Tier 1 1% price sensitive. This package does not include Fibre technology. Tier 2 2% Tier 3 2% Tier 2 is the basic fibre package. It offers the advantages of fibre at a reasonable price. It has the lowest Tier 4 3% download/upload speeds of the three fibre packages, but is still faster than Tier 1. Tier 3 is an upgraded fibre package. This package is designed to provide service to the vast majority of internet users. The speeds associated with this package provide customers with the capability to stream content without issue. Revenue Tier 4 is the premium fibre package. It is designed for users who require low latency, fast speeds and use the routine use of the internet for intensive purposes such as; gaming, video uploading, and The following table provides the current information regarding the pricing of BRSB's various tier conferencing. This is the only Tier providing unlimited data. packages. Budget 2022 assumptions Table 4. Tier Descriptions At the end of 2021, there were 3,369,000 internet subscribers across all packages. Tier Descriptions Overage Fee % of Customers who exceed Price data cap Description (per MB) Subscribers by Tier - EOP 2021 Tier $74.99 $0.15 35% Basic package, low DL/UL speeds, non-fibre Tier 2 $104.99 0.1 25% Basic fibre package, low DL/UL speeds Tier $0.05 15% Subscribers - End of FY 2021 (in thousands) $134.99 upgraded fibre package, moderate DL/UL speeds Tier 1 Tier4 $0.00 0% 807 $159.99 Premium Fibre package, highest DL/UL speeds Tier 657 Another source of revenue to consider are overage fees. Tiers 1-3 have data caps included in their plans, Tier 3 939 3 Tier 4 966 All Tiers 3,369and subscribers who exceed those caps are charged a fee per megabyte of data. A sample of 1000 users across various tiers is given which can be used to form the basis of the assumptions for 2022. However it will be necessary to clean the data provided [Refer to OF Data tab] before it can be used to estimate the average overage fee per subscriber across tiers. In a normal month, 6% of new customers have their activation fees waived. We charge new customers $55 for this activation. Salaries & Wages (Labor) and COGS Salaries & wages are comprised of the labor attributed to: 1) call centers, 2) technicians and 3) administration. Each activation costs the company $65, and 75% of that is solely related to technicians. The remaining 25% of the activation costs are attributed to COGS. In 2021, the administration costs directly related to labor costs were a monthly fixed expense of $1,500,000 per tier. Senior management expects these administration costs to remain the same in 2022. To sell packages, the company utilizes call centers. The call centers operate 8 hours per day, 5 days a week. For 2022, there will be a total of 250 business days in Canada. The total hourly cost of each employee, inclusive of benefits and taxes, is $65, and reps receive $25 for every new sale. The following table lists some expenses related to Bell's internet offerings. Table 5. Cost of revenues per Tier Expenses Network Usage Cost Activation Fee # of Sales Reps Tier 1 $10.00 $55.00 750 General & Tier 2 $20.00 $55.00 1000 Tier 3 $30.00 $55.00 1000 Tier 4 $37.00 $55.00 1500 Administration Expenses and Marketing and Sales Both marketing, sales, and general & administrative expenses are expected to grow by 2% year-over- year in 2022. The following table shows the total 2021 expenses related to internet, in millions. 2021 EXPENSES - FULL YEAR GENERAL & ADMINISTRATION Table 6. 2021 Expenses Summary General Administration Office, Supplies and Equip Bank Charges 93 Real Estate Costs Operating Taxes 84 Professional Fees 69 TMBE 66 Fleet Supplies and Services 96 Information Systems MARKETING & SALES Commissions Advertising Sales Promotions Sponsorship Other Marketing & Sales
Step by Step Solution
There are 3 Steps involved in it
1 Expert Approved Answer
Step: 1 Unlock
Question Has Been Solved by an Expert!
Get step-by-step solutions from verified subject matter experts
Step: 2 Unlock
Step: 3 Unlock
Students Have Also Explored These Related Accounting Questions!