

Question: 1. Create the spreadsheet models shown in Figures 6.3 and 6.4. a. What is the effect of a change in the interest rate from 8%
1. Create the spreadsheet models shown in Figures 6.3 and 6.4. a. What is the effect of a change in the interest rate from 8% to 10% in the
spreadsheet model shown in Figure 6.3?
b. For the original model in Figure 6.3, what interest rate is required to decrease the monthly payments by 20%? What change in the loan amount would have the same effect?
c. In the spreadsheet shown in Figure 6.4, what is the effect of a prepayment of $200 per month? What prepayment would be necessary to pay off the loan in 25 years instead of 30 years?
2. Solve the MBI product-mix problem described in this chapter, using Excels Solver
Examine the solution (output) reports for the answers and sensitivity report. Did you get the same results as reported in this chapter?
Try the sensitivity analysis outlined in the chapter; that is, lower the right-hand side of the CC-8 marketing constraint by one unit, from 200 to 199. What happens to the solution when you solve this modified problem?
Eliminate the CC-8 lower-bound constraint entirely (this can be done easily by either deleting it in Solver or setting the lower limit to zero) and re-solve the problem. What happens? Using the original formulation, try modifying the objective function coefficients and see what happens.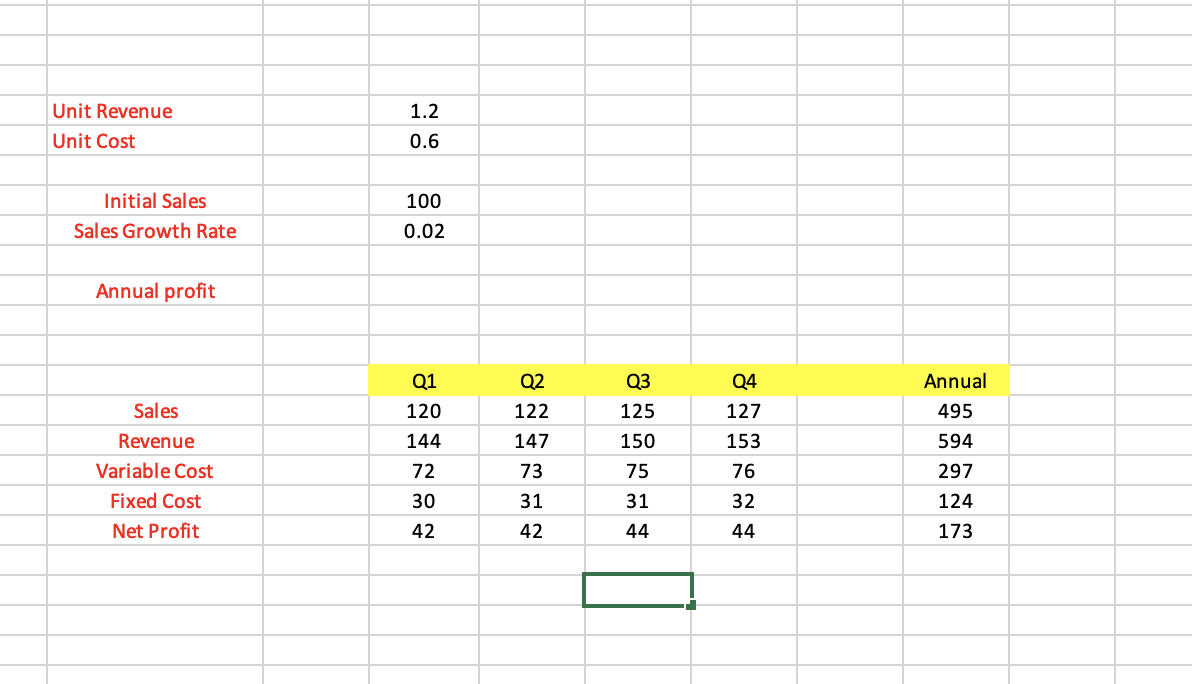
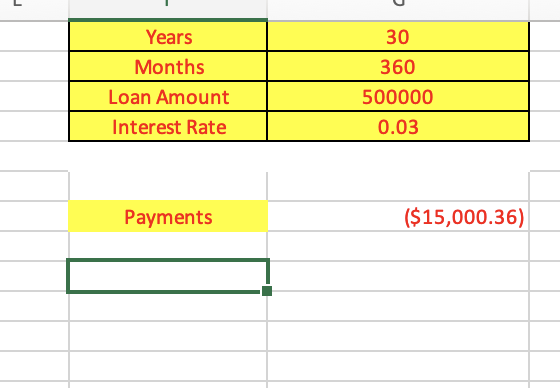
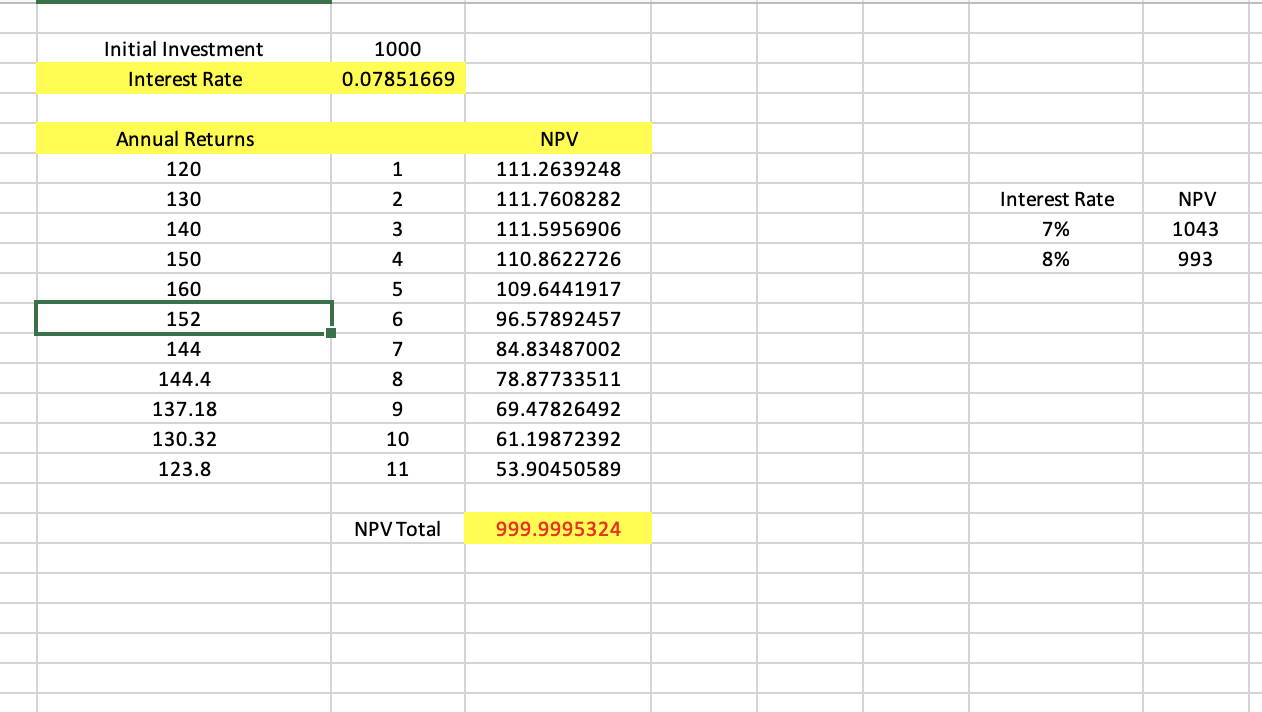
Unit Revenue 1.2 Unit Cost 0.6 Initial Sales Sales Growth Rate 100 0.02 Annual profit Annual Q4 127 153 495 Sales Revenue Variable Cost Fixed Cost Net Profit Q1 120 144 72 30 42 Q2 122 147 73 31 42 Q3 125 150 75 31 594 297 76 32 44 124 44 173 L Years Months Loan Amount Interest Rate 30 360 500000 0.03 Payments ($15,000.36) Initial Investment Interest Rate 1000 0.07851669 Annual Returns 120 130 1 2. NPV Interest Rate 7% 140 3 1043 150 4 8% 993 5 160 152 NPV 111.2639248 111.7608282 111.5956906 110.8622726 109.6441917 96.57892457 84.83487002 78.87733511 69.47826492 61.19872392 53.90450589 6 144 7 8 9 144.4 137.18 130.32 123.8 10 11 NPV Total 999.9995324 Unit Revenue 1.2 Unit Cost 0.6 Initial Sales Sales Growth Rate 100 0.02 Annual profit Annual Q4 127 153 495 Sales Revenue Variable Cost Fixed Cost Net Profit Q1 120 144 72 30 42 Q2 122 147 73 31 42 Q3 125 150 75 31 594 297 76 32 44 124 44 173 L Years Months Loan Amount Interest Rate 30 360 500000 0.03 Payments ($15,000.36) Initial Investment Interest Rate 1000 0.07851669 Annual Returns 120 130 1 2. NPV Interest Rate 7% 140 3 1043 150 4 8% 993 5 160 152 NPV 111.2639248 111.7608282 111.5956906 110.8622726 109.6441917 96.57892457 84.83487002 78.87733511 69.47826492 61.19872392 53.90450589 6 144 7 8 9 144.4 137.18 130.32 123.8 10 11 NPV Total 999.9995324
Step by Step Solution
There are 3 Steps involved in it

Get step-by-step solutions from verified subject matter experts