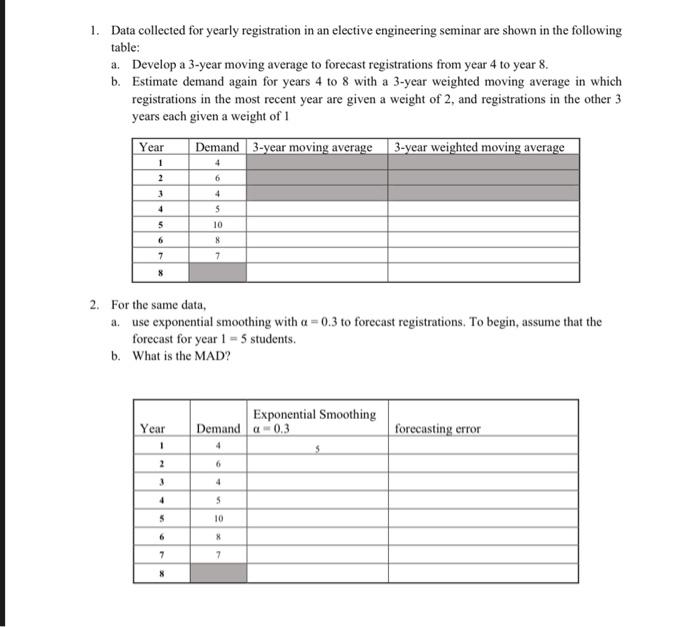
Question: 1. Data collected for yearly registration in an elective engineering seminar are shown in the following table: a. Develop a 3-year moving average to forecast

1. Data collected for yearly registration in an
1. Data collected for yearly registration in an elective engineering seminar are shown in the following table: a. Develop a 3-year moving average to forecast registrations from year 4 to year 8. b. Estimate demand again for years 4 to 8 with a 3-year weighted moving average in which registrations in the most recent year are given a weight of 2, and registrations in the other 3 years each given a weight of 1 Year Demand 3-year moving average 3-year weighted moving average 4 6 1 2 3 4 4 5 5 10 6 8 7 7 2. For the same data, a. use exponential smoothing with a = 0.3 to forecast registrations. To begin, assume that the forecast for year 1 = 5 students. b. What is the MAD? Year 1 Exponential Smoothing Demand a -0.3 forecasting error 4 2 6 3 4 4 5 5 10 7 7

Step by Step Solution

There are 3 Steps involved in it

1 Expert Approved Answer
Step: 1 Unlock blur-text-image
Question Has Been Solved by an Expert!

Get step-by-step solutions from verified subject matter experts

Step: 2 Unlock
Step: 3 Unlock

Students Have Also Explored These Related General Management Questions!