

Question: 1 Data Table $ 361,000 $ 20,000 Direct Labor Efficiency Variance Variable Overhead Efficiency Variance Cost of Goods Sold (at standard) Sales Revenue (at standard)
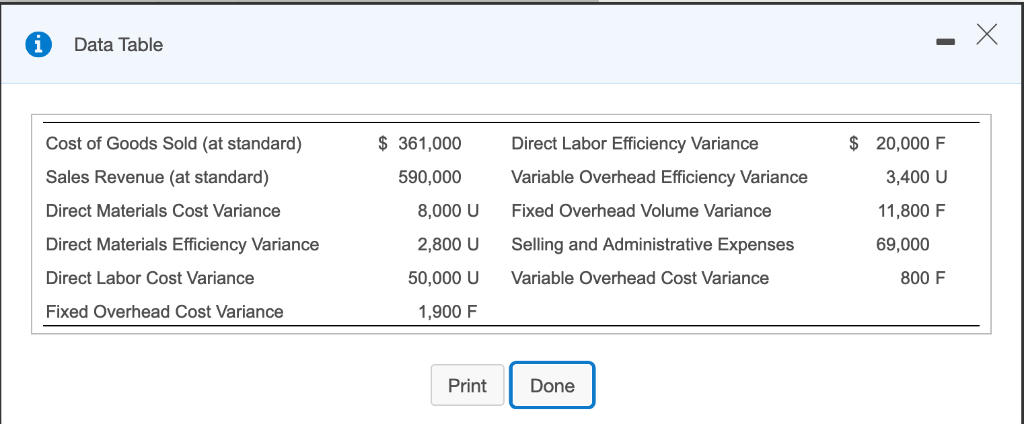
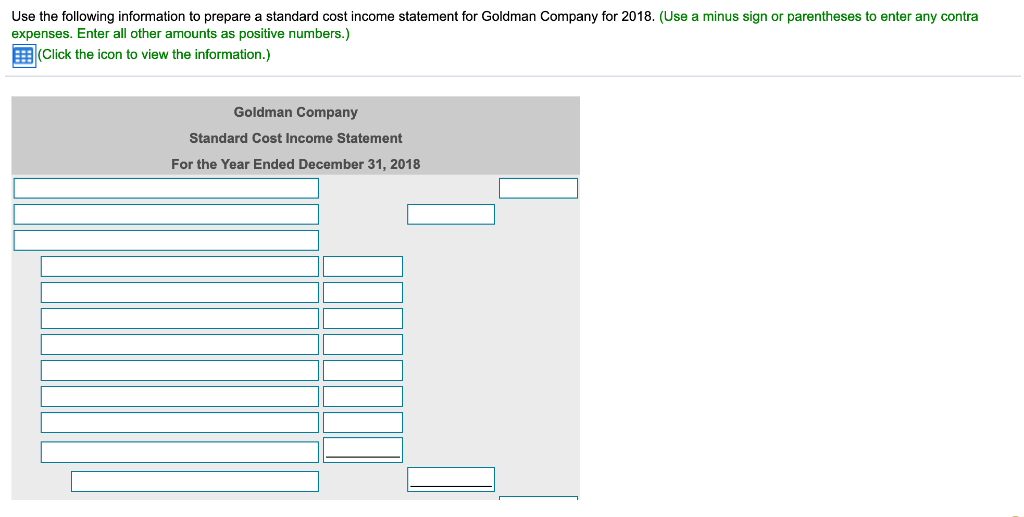
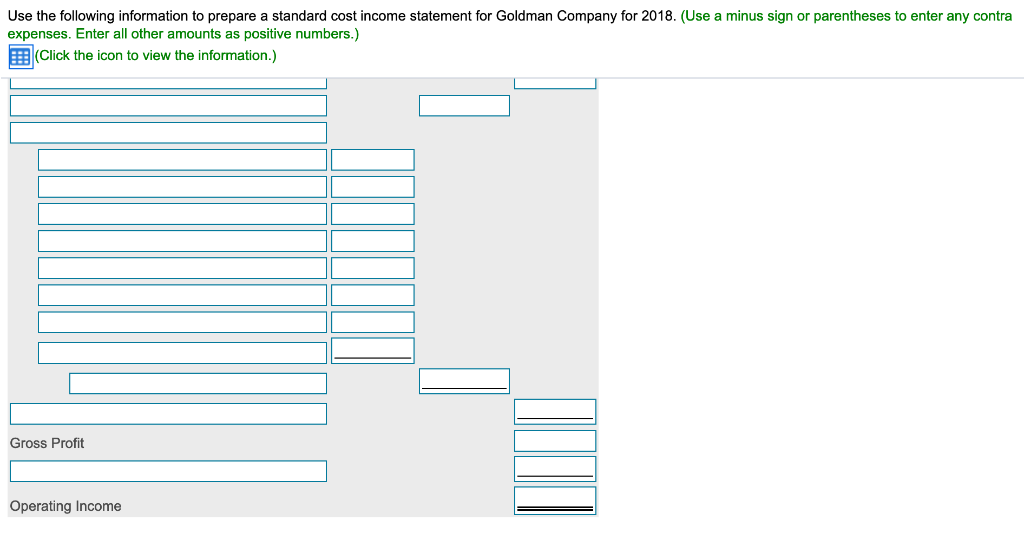
1 Data Table $ 361,000 $ 20,000 Direct Labor Efficiency Variance Variable Overhead Efficiency Variance Cost of Goods Sold (at standard) Sales Revenue (at standard) Direct Materials Cost Variance Direct Materials Efficiency Variance Direct Labor Cost Variance Fixed Overhead Cost Variance 590,000 3,400 U 11,800 F 69,000 8,000 Fixed Overhead Volume Variance 2,800 U Selling and Administrative Expenses 50,000 U Variable Overhead Cost Variance 800 F 1,900 F PrintDone Use the following information to prepare a standard cost income statement for Goldman Company for 2018. (Use a minus sign or parentheses to enter any contra expenses. Enter all other amounts as positive numbers.) (Click the icon to view the information.) Goldman Company Standard Cost Income Statement For the Year Ended December 31, 2018 Use the following information to prepare a standard cost income statement for Goldman Company for 2018. (Use a minus sign or parentheses to enter any contra expenses. Enter all other amounts as positive numbers.) (Click the icon to view the information.) Gross Profit Operating Income
Step by Step Solution
There are 3 Steps involved in it

Get step-by-step solutions from verified subject matter experts