

Question: 1: Data Table (Click on the icon here in order to copy the contents of the data table below into a spreadsheet.) Year 1 2
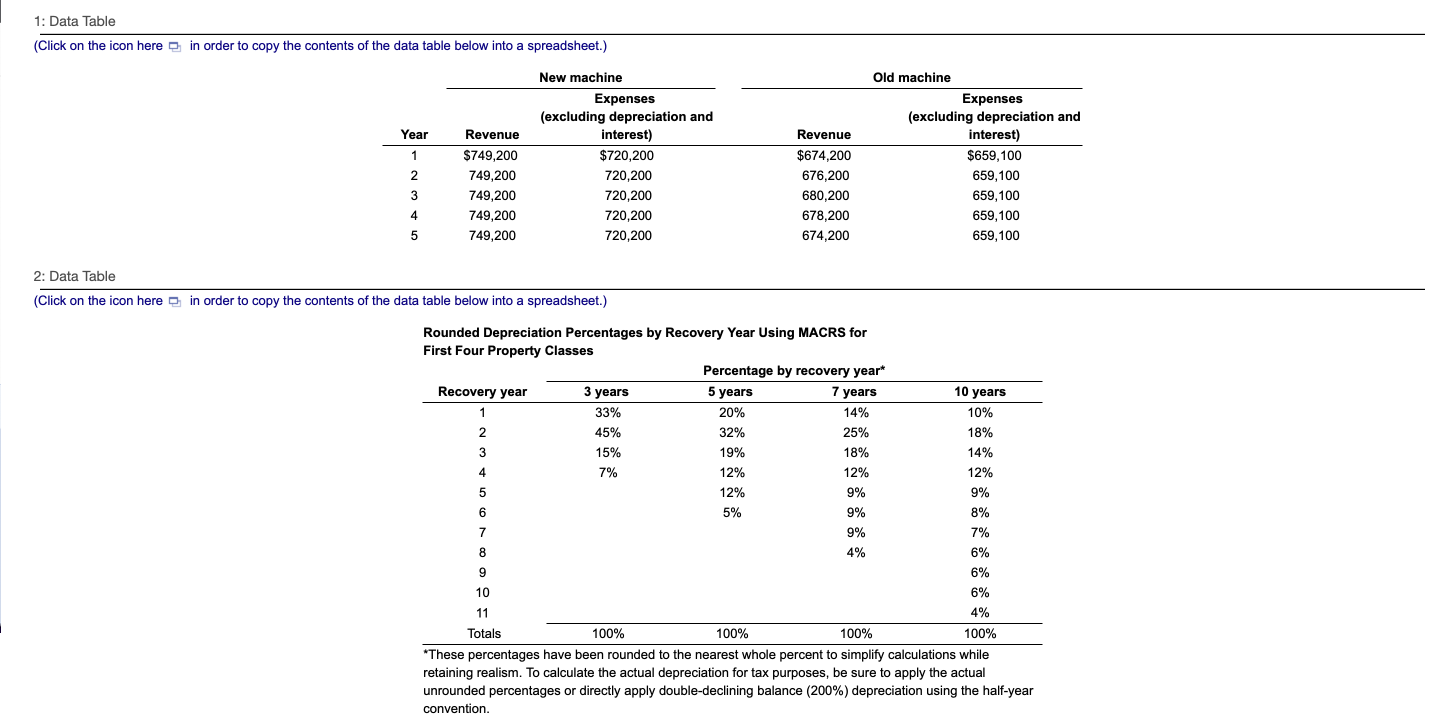
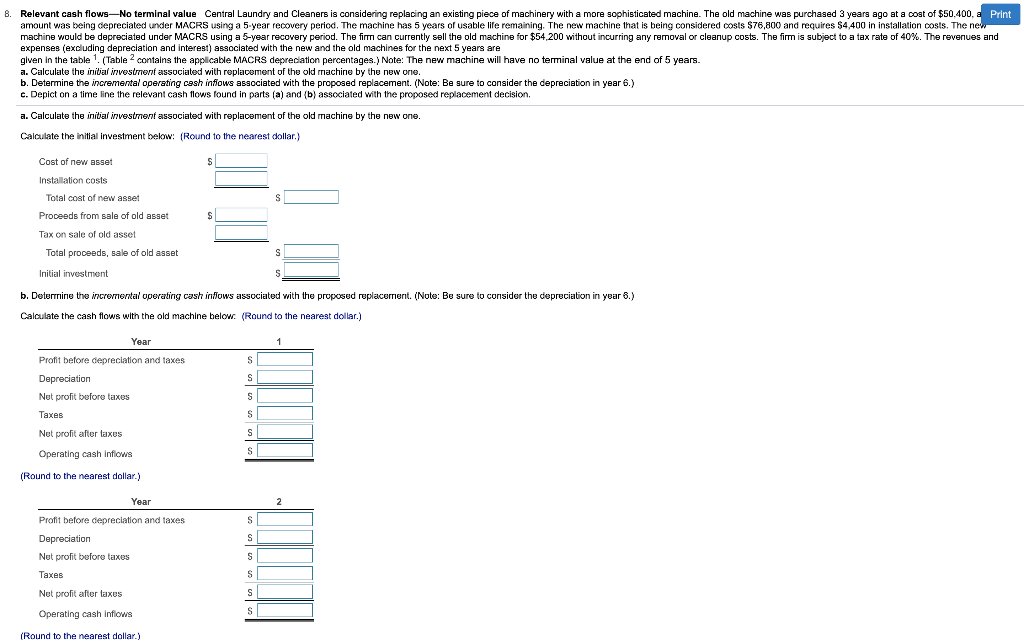
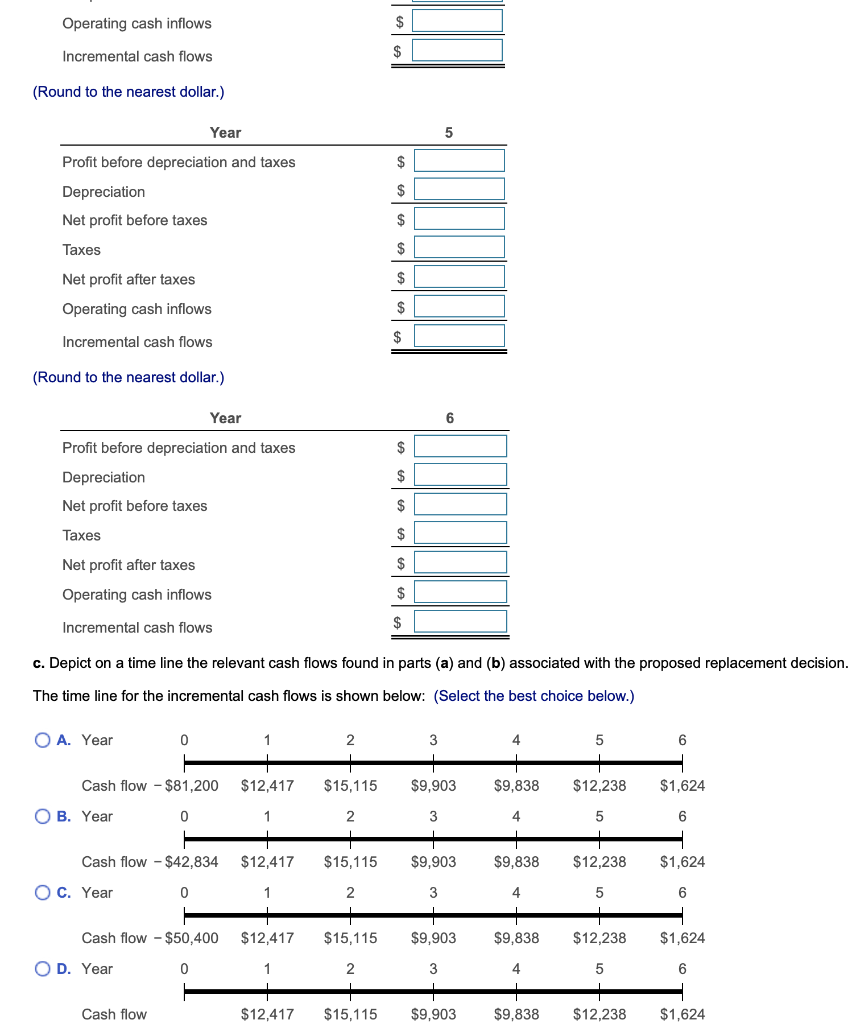
1: Data Table (Click on the icon here in order to copy the contents of the data table below into a spreadsheet.) Year 1 2 Revenue $749,200 749,200 749,200 749,200 749,200 New machine Expenses (excluding depreciation and interest) $720,200 720,200 720,200 720,200 720,200 Revenue $674,200 676,200 680,200 678.200 674,200 Old machine Expenses (excluding depreciation and interest) $659,100 659,100 659,100 659,100 659,100 3 4 5 2: Data Table (Click on the icon here in order to copy the contents of the data table below into a spreadsheet.) 25% Rounded Depreciation Percentages by Recovery Year Using MACRS for First Four Property Classes Percentage by recovery year* Recovery year 3 years 5 years 7 years 10 years 1 33% 20% 14% 10% 2 45% 32% 18% 3 15% 19% 18% 14% 4 7% 7 12% 12% 12% 5 12% 9% 9% 6 5% 9% 8% 7 9% 7% 8 4% 6% 9 6% 10 6% 6 11 4% Totals 100% 100% 100% 100% *These percentages have been rounded to the nearest whole percent to simplify calculations while retaining realism. To calculate the actual depreciation for tax purposes, be sure to apply the actual unrounded percentages or directly apply double-declining balance (200%) depreciation using the half-year convention. 6 8. Relevant cash flowsNo terminal value Central Laundry and Cleaners is considering replacing an existing piece of machinery with a more sophisticated machine. The old machine was purchased 3 years ago at a cost of $50.400, a Print amount was being depreciated under MACRS using a 5-year recovery period. The machine has 5 years of usable life remaining. The new machine that is being considered costs $76,800 and requires $4,400 in installation costs. The new machine would be depreciated under MACRS using a 5-year recovery period. The firm can currently sell the old machine for $54,200 without incurring any removal or cleanup costs. The firm is subject to a tax rate of 40%. The revenues and expenses (excluding depreciation and interest) associated with the new and the old machines for the next 5 years are given in the table 1 (Table 2 contains the applicable MACRS depreciation percentages.) Note: The new machine will have no terminal value at the end of 5 years. a. Calculate the initial investment associated with replacement of the old machine by the new one. b. Determine the incremental operating cash inflows associated with the proposed replacement. (Note: Be sure to consider the depreciation in year 6.) c. Depict on a timeline the relevant cash flows found in parts (a) and (b) associated with the proposed replacement decision, a. Calculate the initial investment associated with replacement of the old machine by the new one. Calculate the initial investment below: (Round to the nearest dollar.) Cost of new asset Installation costs Total cost of new asset Proceeds from sale of old asset s Tax on sale of old asset Total proceeds, sale of old asset Initial investment b. Determine the incremental operating cash inflows associated with the proposed replacement. (Note: Be sure to consider the depreciation in year 8.) Calculate the cash flows with the old machine below. (Round to the nearest dollar.) Year 1 $ S Profit before depreciation and taxes Depreciation Net profit before taxes Taxes S S Net profit after taxes S Operating cash inflows S (Round to the nearest dollar.) Year Profit before depreciation and taxes Depreciation Net profit before taxes Taxes lini Net profit after taxes Operating cash inflows (Round to the nearest dollar. Year 3 Profit before depreciation and taxes Depreciation Net profit before taxes $ $ Taxes $ Net profit after taxes $ Operating cash inflows $ (Round to the nearest dollar.) Year 4 Profit before depreciation and taxes Depreciation Net profit before taxes $ $ Taxes $ Net profit after taxes $ Operating cash inflows $ (Round to the nearest dollar.) Year 5 Profit before depreciation and taxes $ $ Depreciation Net profit before taxes $ Taxes $ Net profit after taxes $ Operating cash inflows $ (Round to the nearest dollar.) Year 6 Profit before depreciation and taxes $ Depreciation $ Net profit before taxes Taxes $ Net profit after taxes $ $ Operating cash inflows Calculation the cash flows with the new machine and the incremental cash flows below: (Round to the nearest dollar.) Year 1 $ Profit before depreciation and taxes Depreciation Net profit before taxes $ $ Taxes $ $ Net profit after taxes Operating cash inflows $ Incremental cash flows $ (Round to the nearest dollar.) Year 2 $ Profit before depreciation and taxes Depreciation Net profit before taxes $ $ Taxes $ Net profit after taxes $ Operating cash inflows $ Incremental cash flows $ (Round to the nearest dollar.) Year 3 Profit before depreciation and taxes Depreciation A A A $ Net profit before taxes Taxes $ Net profit after taxes $ Operating cash inflows $ Incremental cash flows $ (Round to the nearest dollar.) Year Profit before depreciation and taxes $ $ Depreciation Net profit before taxes $ Taxes $ Net profit after taxes $ Operating cash inflows $ Incremental cash flows $ (Round to the nearest dollar.) Year 5 $ Profit before depreciation and taxes Depreciation Net profit before taxes $ $ Taxes $ $ Net profit after taxes Operating cash inflows $ Incremental cash flows $ (Round to the nearest dollar.) Year 6 $ Profit before depreciation and taxes Depreciation Net profit before taxes $ $ Taxes $ $ Net profit after taxes Operating cash inflows $ Incremental cash flows $ c. Depict on a time line the relevant cash flows found in parts (a) and (b) associated with the proposed replacement decision. The time line for the incremental cash flows is shown below: (Select the best choice below.) O A. Year 0 1 2 3 4 5 6 Cash flow - $81,200 $12,417 $15,115 $9,903 $9,838 $12,238 $1,624 OB. Year 0 1 2 3 4 5 6 Cash flow - $42,834 $12,417 $15,115 $9,903 $9,838 $12,238 $1,624 O c. Year 0 1 2 3 4 5 6 Cash flow - $50,400 $12,417 $15,115 $9,903 $9,838 $12,238 $1,624 OD. Year 0 2 3 5 6 Cash flow $12,417 $15,115 $9,903 $9,838 $12,238 $1,624
Step by Step Solution
There are 3 Steps involved in it

Get step-by-step solutions from verified subject matter experts