

Question: 1. Data: This project makes use of annual data for two risky securities: the S&P 500 Index and Gold. Annual values for each of these
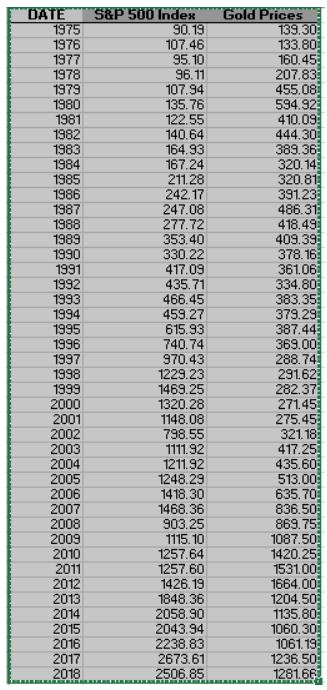
1. Data: This project makes use of annual data for two risky securities: the S&P 500 Index and Gold. Annual values for each of these securities during the period from 1975-2018 are provided in a spreadsheet posted on Blackboard.
You should use an annual risk-free rate of 4% for this project.
2. Return Calculations: Calculate annual returns for each of the two securities from 1976 through 2018. Calculate the average annual return, the standard deviation of annual returns, and the correlation between the returns of the two securities during this period and fill in the table provided. (Note: all of these calculations are based on annual security % returns NOT index values). Attach the spreadsheet showing all of the relevant calculations as Exhibit 1 .
S&P 500
Gold
Average Annual Return
Standard Deviation of Annual Returns
Return Correlation(S&P,Gold)
Some useful Excel functions: to compute average return, use the function AVERAGE; for standard deviation, use STDEV; for correlation, use CORREL.
3. Capital Allocation Lines: Assume that the mean return, standard deviation, and correlation estimates you calculated above provide a reasonable forecast of the expected returns and risks of these securities for the coming year. Based on these forecasts, plot the two risky securities on an expected return - standard deviation graph. Also, plot the risk-free security. Be sure to label all three securities on the graph. Draw the Capital Allocation Line for each of the risky securities (S&P and Gold). Attach the graph as Exhibit 2.
4. Risky Portfolios: Calculate the expected returns and standard deviations of portfolios that combine the two risky securities (S&P and Gold), varying weights from 0% to 100% in increments of 5% (note: this should result in 21 portfolios). Attach the spreadsheet showing all relevant calculations as Exhibit 3 .
5. The Opportunity Set and the Tangency Portfolio: Plot the risk-free security and the 21 portfolios described in question 4 on an expected return - standard deviation graph. Be sure to clearly label the S&P 500, Gold, and the risk-free security on the graph. Identify and label the minimum variance portfolio on the graph. Identify and label the optimal risky portfolio (a.k.a. the tangency portfolio) on the graph and draw the Capital Allocation Line (CAL) for this portfolio. Attach the graph as Exhibit 4 .
(a) What are the portfolio weights in the Tangency Portfolio? What are the mean and standard deviation of the Tangency Portfolio?
(b) What are the portfolio weights in the Minimum Variance Portfolio? What are the mean and standard deviation of the Minimum Variance Portfolio?
(c) What are the portfolio weights in the Equal-Weighted Portfolio? What are the mean and standard deviation of the Equal-Weighted Portfolio?
DATE S&P 500 Index 90.19 107.46 95.10 96.11 1975 1976 1977 1978 1979 1980 1981 1982 1983 1984 1985 1986 1987 1988 1989 1990 1991 1992 1993 1994 1995 1996 1997 1998 1999 2000 2001 2002 2003 2004 2005 2006 2007 2008 2009 2010 2011 2012 2013 2014 2015 2016 2017 2018 107.94 135.76 122.55 140.64 164.93 167.24 211.28 242.17 247.08 277.72 353.40 330.22 417.09 435.71 466.45 459.27 615.93 740.74 970.43 1229.23 1469.25 1320.28 1148.08 798.55 1111.92 1211.92 1248.29 1418.30 1468.36 903.25 1115.10 1257.64 1257.60 1426.19 1848.36 2058.90 2043.94 2238.83 2673.61 2506.85 Gold Prices 139.30 133.80 160.45: 207.83 455.08 594.92 410.09 444.30 389.36 320.14 320.81 391.23 486.31 418.49 409.39 378.16 361.06 334.80 383.35 379.29 387.44 369.00 288.74 291.62 282.37 271.45 275.45 321.18 417.25 435.60 513.00 635.70 836.50 869.75 1087.50 1420.25 1531.00 1664.00 1204.50 1135.80 1060.30 1061.19 1236.50 1281.660 KARARINI
Step by Step Solution
3.55 Rating (165 Votes )
There are 3 Steps involved in it
To solve the problem follow these steps 1 Return Calculations Calculate the annual returns for each of the two securities from 1976 to 2018 Steps Calc... View full answer

Get step-by-step solutions from verified subject matter experts