

Question: 1. Define probability: Experimental Probability 2. Directions: Work individually. Roll two dice Bl] times using the random number generator on exec record the sums and
![dice Bl] times using the random number generator on exec record the](https://dsd5zvtm8ll6.cloudfront.net/si.experts.images/questions/2024/10/670984639dc5f_963670984637dec9.jpg)
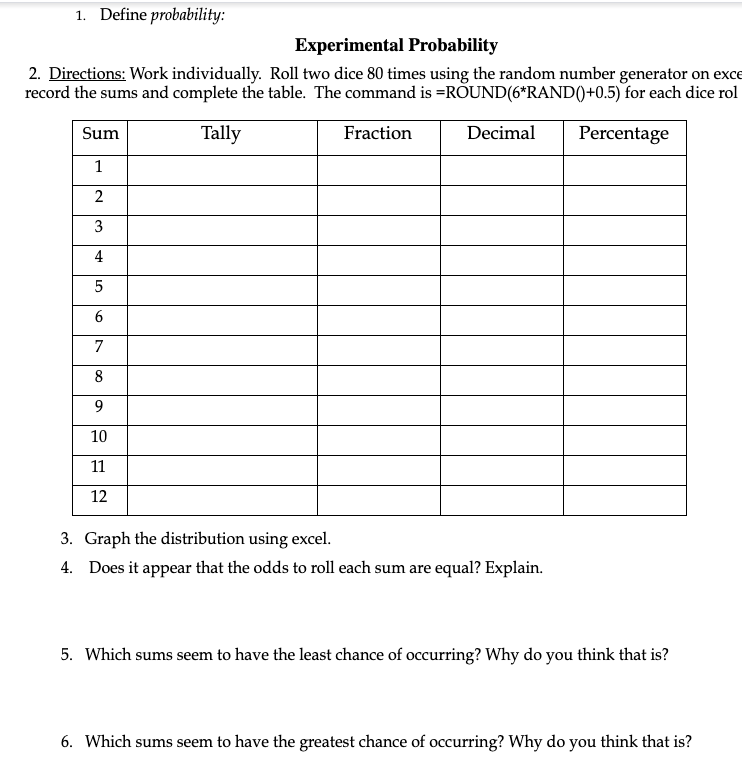
1. Define probability: Experimental Probability 2. Directions: Work individually. Roll two dice Bl] times using the random number generator on exec record the sums and complete the table. The command 1s =RDUND[*RAND{)+I1}5} for each dice ml m -__ - - "___ - n - n n - - - 3. Graph the distribution using excel. 4. Does it appear that the odds to roll each 5un1 are equal? Explain. 5. Wish sums seem to have the least chance of occurring? Why do you think that is? 6. Wish sums seem to have the greatest chance of occurring? \"F113: do you think that is? Theoretical Probability 6. Directions: In the table, list all possible outcomes that produce a given sum when tossing 2 dice. Sum Possible Events (Rolling 2 Dice) | Fraction| Decimal Percentage 1 2 3 4 5 6 7 8 9 10 11 12 7. Graph the distribution using excel. 8. How many total outcomes are there when each dice are tossed? 9. How close did your results of experimental probability come to the expected theoretical probability? Give multiple examples by discussing the SUMS that were close in percent for both types of probability. 10. In your own words, describe the difference between experimental and theoretical probability by discussing specifically what both measure 11. What would happen if you had 100 rolls of 2 dice? 1 million rolls? *Submit your excel file with answer to these questions
Step by Step Solution
There are 3 Steps involved in it

Get step-by-step solutions from verified subject matter experts