Question: 1. Define the following: 3. Nominal dollars b. Constant dollars 2. Lake City's park gazebo is available for residents to rent for picnics and other
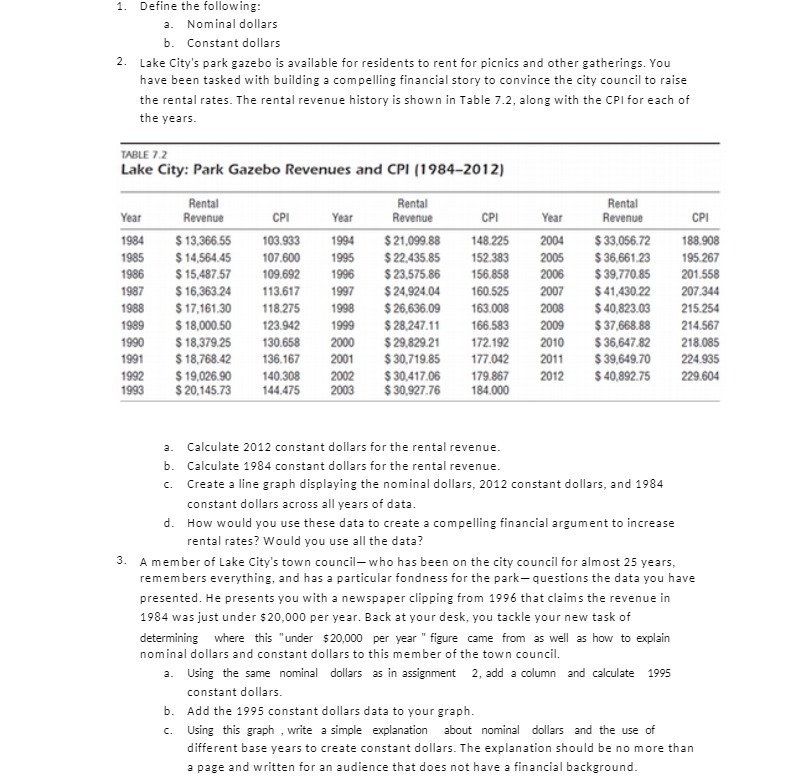
1. Define the following: 3. Nominal dollars b. Constant dollars 2. Lake City's park gazebo is available for residents to rent for picnics and other gatherings. You have been tasked with building a compelling financial story to convince the city council to raise the rental rates. The rental revenue history is shown in Table 7.2, along with the CPI for each of the years. TABLE 7.2 Lake City: Park Gazebo Revenues and CPI (1984-2012) Rental Renta Rental Year Revenue CPI Year Revenue CPI Year Revenue CPI 1984 $ 13,366.55 103.933 1994 $ 21.099.88 148.225 2004 $ 33,056.72 188.908 1985 $ 14,564.45 107.600 1995 $ 22.435.85 152.383 2005 $ 36,661.23 195.267 1986 $ 15,487.57 109.692 1996 $ 23,575.86 156.858 2006 $ 39,770.85 201.558 1987 $ 16,363.24 113.617 1997 $ 24,924.04 160.525 2007 $ 41,430.22 207.344 1988 $ 17,161.30 118.275 1998 $ 26.636.09 163.008 2008 $ 40,823.03 215.254 1989 $ 18,000.50 123.942 1999 $ 28.247.11 166.583 2009 $ 37.668.88 214.567 1990 $ 18,379.25 130.658 2000 $ 29,829.21 172.192 2010 $ 36,647.82 218.085 1991 $ 18,768.42 136.167 2001 $ 30,719.85 177.042 2011 $ 39,649.70 224.935 1992 $ 19,026.90 140.308 2002 $ 30,417.06 179.867 2012 $ 40,892.75 229.604 1993 $ 20,145.73 144.475 2003 $ 30.927.76 184.000 a. Calculate 2012 constant dollars for the rental revenue. b. Calculate 1984 constant dollars for the rental revenue. C. Create a line graph displaying the nominal dollars, 2012 constant dollars, and 1984 constant dollars across all years of data. d. How would you use these date to create a compelling financial argument to increase rental rates? Would you use all the data? 3. A member of Lake City's town council- who has been on the city council for almost 25 years, remembers everything, and has a particular fondness for the park- questions the date you have presented. He presents you with a newspaper clipping from 1996 that claims the revenue in 1984 was just under $20,000 per year. Back at your desk, you tackle your new task of determining where this "under $20,000 per year " figure came from as well as how to explain nominal dollars and constant dollars to this member of the town council. Using the same nominal dollars as in assignment 2, add a column and calculate 1995 constant dollars. b. Add the 1995 constant dollars data to your graph. c. Using this graph , write a simple explanation about nominal dollars and the use of different base years to create constant dollars. The explanation should be no more than a page and written for an audience that does not have a financial