

Question: 1. Describe the possible relation between the variables provided in the data set. 2. Propose a suitable model that describes the relations in 1. and
1. Describe the possible relation between the variables provided in the data set.
2. Propose a suitable model that describes the relations in 1. and justify your answer
3. Use your model proposed in 2. to predict the Revenue generated from the enumber of persons hired for the bus services
4. Write the possible reasons for fluctuations in the trend produce by number of persons hired in the bus service
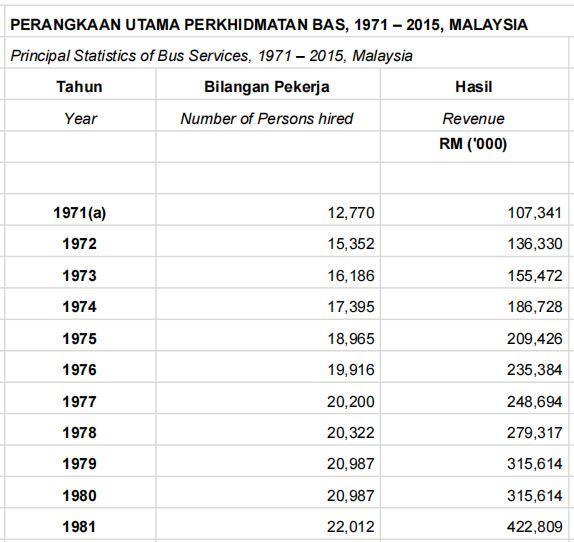
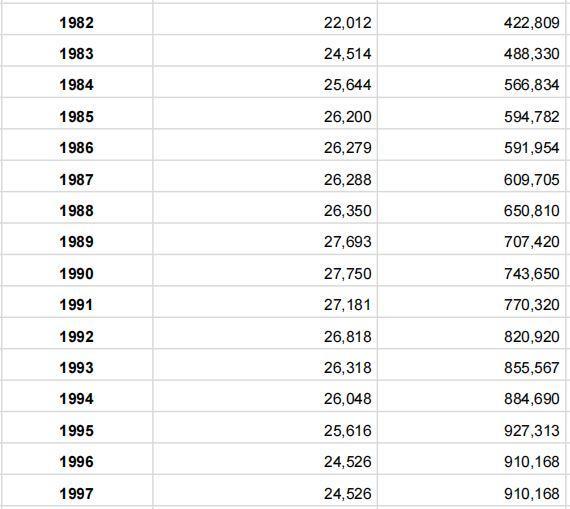
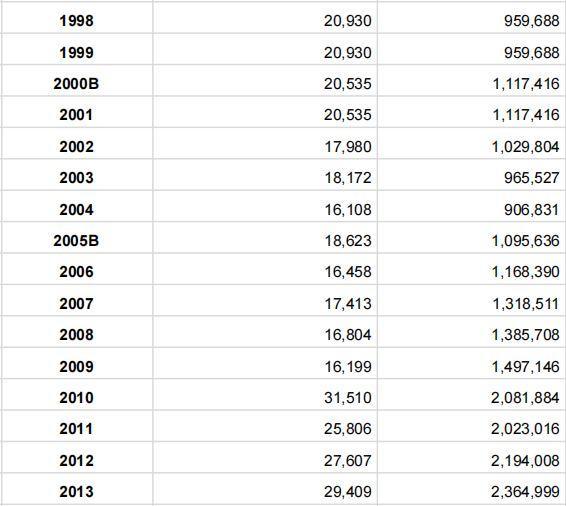
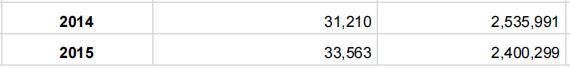
PERANGKAAN UTAMA PERKHIDMATAN BAS, 1971 - 2015, MALAYSIA Principal Statistics of Bus Services, 1971 - 2015, Malaysia Tahun Bilangan Pekerja Hasil Year Number of Persons hired Revenue RM ('000) 1971(a) 12,770 107,341 1972 15,352 136,330 1973 16, 186 155,472 1974 17,395 186,728 1975 18,965 209,426 1976 19,916 235,384 1977 20,200 248,694 1978 20,322 279,317 1979 20,987 315,614 1980 20,987 315,614 1981 22,012 422,809
Step by Step Solution
3.38 Rating (157 Votes )
There are 3 Steps involved in it

Get step-by-step solutions from verified subject matter experts