

Question: 1. Design one worksheet to enter values specified below and to display the output of the model. a. The entry and display area fits within
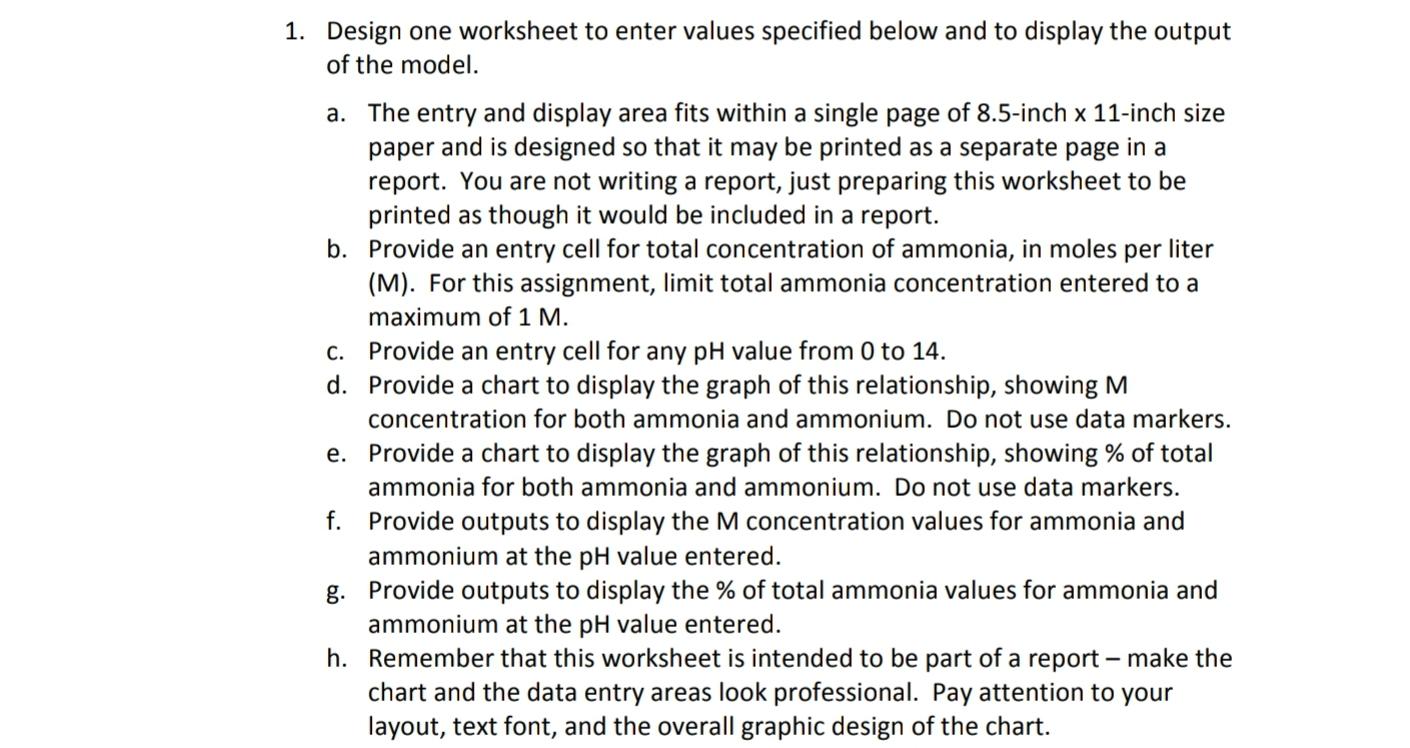
1. Design one worksheet to enter values specified below and to display the output of the model. a. The entry and display area fits within a single page of 8.5-inch x 11-inch size paper and is designed so that it may be printed as a separate page in a report. You are not writing a report, just preparing this worksheet to be printed as though it would be included in a report. b. Provide an entry cell for total concentration of ammonia, in moles per liter (M). For this assignment, limit total ammonia concentration entered to a maximum of 1 M. C. Provide an entry cell for any pH value from 0 to 14. d. Provide a chart to display the graph of this relationship, showing M concentration for both ammonia and ammonium. Do not use data markers. e. Provide a chart to display the graph of this relationship, showing % of total ammonia for both ammonia and ammonium. Do not use data markers. f. Provide outputs to display the M concentration values for ammonia and ammonium at the pH value entered. g. Provide outputs to display the % of total ammonia values for ammonia and ammonium at the pH value entered. h. Remember that this worksheet is intended to be part of a report - make the chart and the data entry areas look professional. Pay attention to your layout, text font, and the overall graphic design of the chart. 1. Design one worksheet to enter values specified below and to display the output of the model. a. The entry and display area fits within a single page of 8.5-inch x 11-inch size paper and is designed so that it may be printed as a separate page in a report. You are not writing a report, just preparing this worksheet to be printed as though it would be included in a report. b. Provide an entry cell for total concentration of ammonia, in moles per liter (M). For this assignment, limit total ammonia concentration entered to a maximum of 1 M. C. Provide an entry cell for any pH value from 0 to 14. d. Provide a chart to display the graph of this relationship, showing M concentration for both ammonia and ammonium. Do not use data markers. e. Provide a chart to display the graph of this relationship, showing % of total ammonia for both ammonia and ammonium. Do not use data markers. f. Provide outputs to display the M concentration values for ammonia and ammonium at the pH value entered. g. Provide outputs to display the % of total ammonia values for ammonia and ammonium at the pH value entered. h. Remember that this worksheet is intended to be part of a report - make the chart and the data entry areas look professional. Pay attention to your layout, text font, and the overall graphic design of the chart
Step by Step Solution
There are 3 Steps involved in it

Get step-by-step solutions from verified subject matter experts