

Question: 1. Determine the equations of the polynomials whose graphs pass through the given points. Plot each polynomial and mark the given data points (see provided
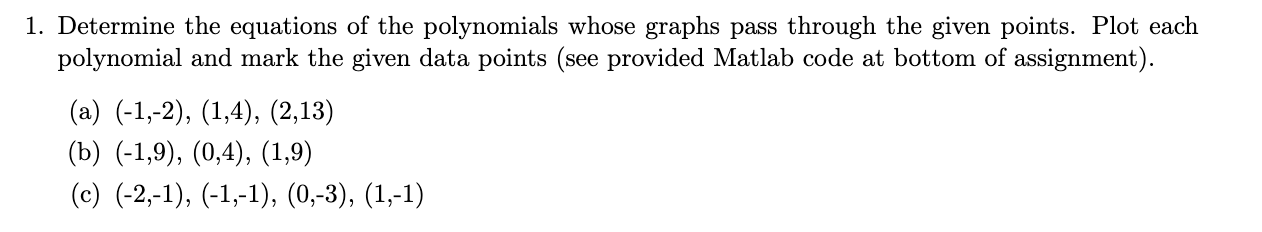
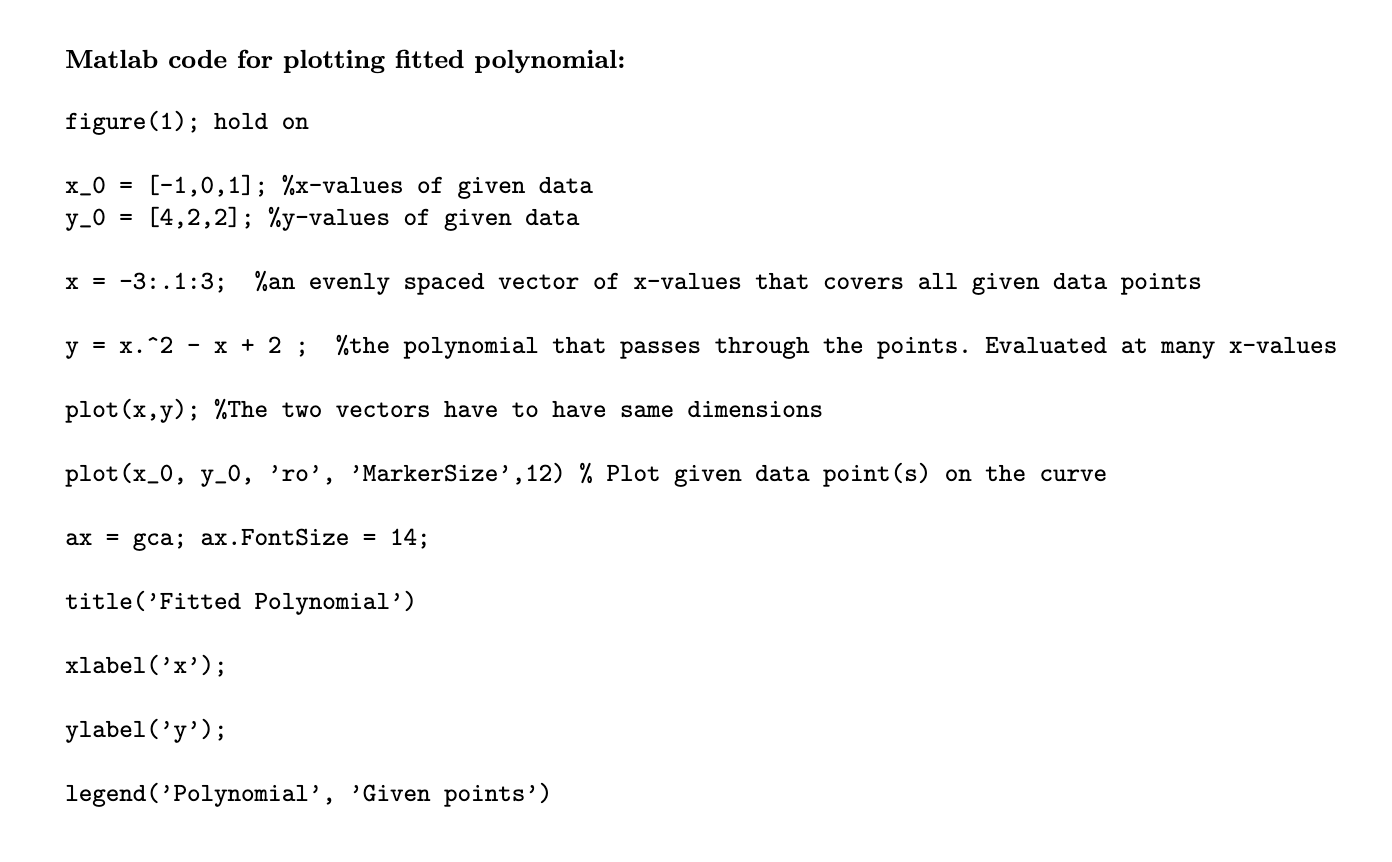
1. Determine the equations of the polynomials whose graphs pass through the given points. Plot each polynomial and mark the given data points (see provided Matlab code at bottom of assignment). (a) (1,2),(1,4),(2,13) (b) (1,9),(0,4),(1,9) (c) (2,1),(1,1),(0,3),(1,1) Matlab code for plotting fitted polynomial: figure(1); hold on x0=[1,0,1];%-values of given data y0=[4,2,2];%-values of given data x=3:.1:3; \%an evenly spaced vector of x-values that covers all given data points y=x2x+2; \%the polynomial that passes through the points. Evaluated at many x-values plot (x,y); \%The two vectors have to have same dimensions plot(x_0, y_0, 'ro', 'MarkerSize', 12) \% Plot given data point(s) on the curve ax= gca; ax.FontSize =14; title('Fitted Polynomial') xlabel('x') ylabel('y') legend ('Polynomial', 'Given points')
Step by Step Solution
There are 3 Steps involved in it

Get step-by-step solutions from verified subject matter experts