

Question: 1) Develop a histogram and frequency distribution for the following temperature measurements: 2 6 Reading # Temperature (C) Reading # Temperature (C) 1 51.1 16
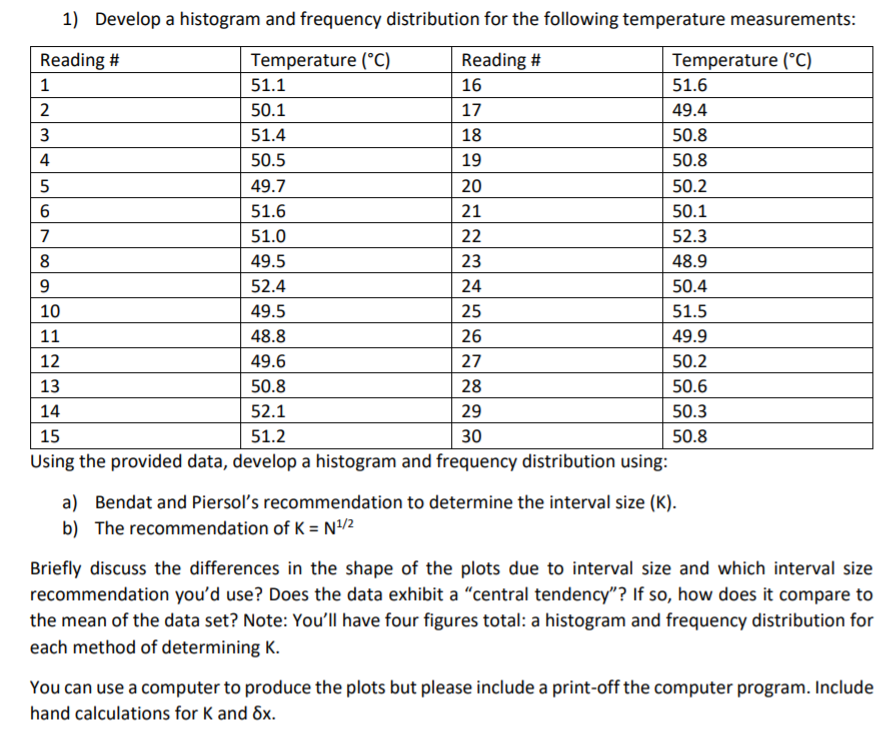
1) Develop a histogram and frequency distribution for the following temperature measurements: 2 6 Reading # Temperature (C) Reading # Temperature (C) 1 51.1 16 51.6 2 50.1 17 49.4 3 51.4 18 50.8 4 50.5 19 50.8 5 49.7 20 50.2 6 51.6 21 50.1 7 51.0 22 52.3 8 49.5 23 48.9 9 52.4 24 50.4 10 49.5 25 51.5 11 48.8 26 49.9 12 49.6 27 50.2 13 50.8 28 50.6 14 52.1 29 50.3 15 51.2 30 50.8 Using the provided data, develop a histogram and frequency distribution using: a) Bendat and Piersol's recommendation to determine the interval size (K). b) The recommendation of K = N1/2 Briefly discuss the differences in the shape of the plots due to interval size and which interval size recommendation you'd use? Does the data exhibit a central tendency"? If so, how does it compare to the mean of the data set? Note: You'll have four figures total: a histogram and frequency distribution for each method of determining K. You can use a computer to produce the plots but please include a print-off the computer program. Include hand calculations for K and 8x. 1) Develop a histogram and frequency distribution for the following temperature measurements: 2 6 Reading # Temperature (C) Reading # Temperature (C) 1 51.1 16 51.6 2 50.1 17 49.4 3 51.4 18 50.8 4 50.5 19 50.8 5 49.7 20 50.2 6 51.6 21 50.1 7 51.0 22 52.3 8 49.5 23 48.9 9 52.4 24 50.4 10 49.5 25 51.5 11 48.8 26 49.9 12 49.6 27 50.2 13 50.8 28 50.6 14 52.1 29 50.3 15 51.2 30 50.8 Using the provided data, develop a histogram and frequency distribution using: a) Bendat and Piersol's recommendation to determine the interval size (K). b) The recommendation of K = N1/2 Briefly discuss the differences in the shape of the plots due to interval size and which interval size recommendation you'd use? Does the data exhibit a central tendency"? If so, how does it compare to the mean of the data set? Note: You'll have four figures total: a histogram and frequency distribution for each method of determining K. You can use a computer to produce the plots but please include a print-off the computer program. Include hand calculations for K and 8x
Step by Step Solution
There are 3 Steps involved in it

Get step-by-step solutions from verified subject matter experts