

Question: 1. Develop the statement of cash flow for the most recent two years and explain how Greg would sum up the companys cash position. 2.
1. Develop the statement of cash flow for the most recent two years and explain how Greg would sum up the companys cash position. 2. Perform a trend analysis on the companys liquidity, leverage, turnover, and profitability ratios. Help Greg present an appraisal of the companys financial ratios compared with its key competitors. 3. Using common size financial statements, help Greg present an appraisal of the companys performance and financial condition vis--vis its key competitors. 4. What would Greg discover after performing a DuPont analysis (both in trend and in comparison with its key competitors) on the companys key profitability ratios? 5. How much additional sales can the company support without having to add fixed assets? 6. Will Paramount Paper have to raise external capital over the next 12 months? If so how much? If not, why not? (Note: 10% increase from the base for optimistic scenario and 10% decrease from the base for pessimistic scenario) 7. Is Warren correct in saying there is more to us than meets the eye? Explain. 8. If you are Warren, explain how you would attempt to convince the rating agencies that the firms debt rating should be raised.
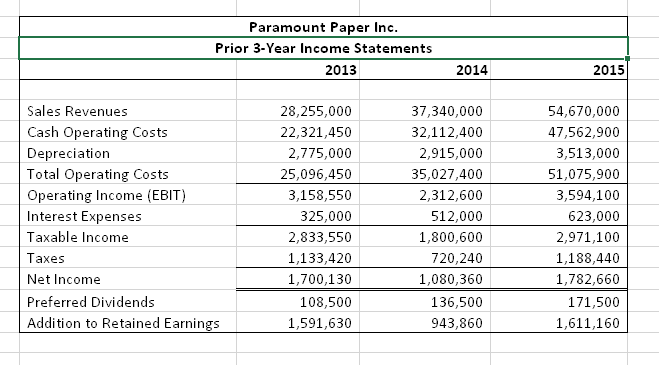
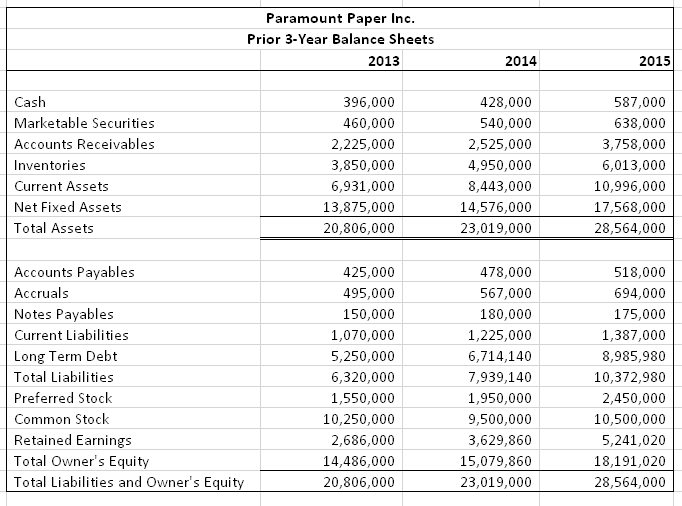
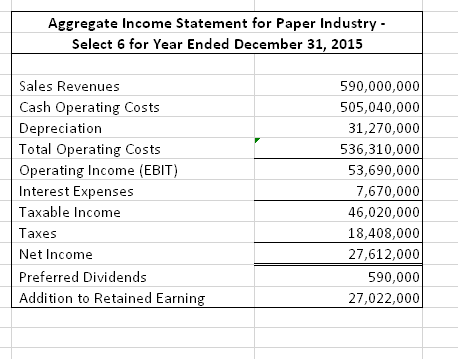
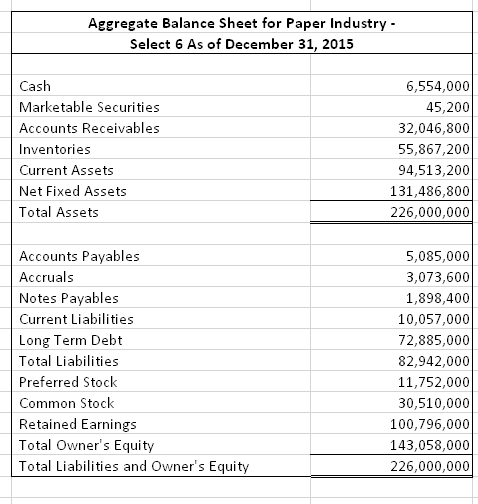
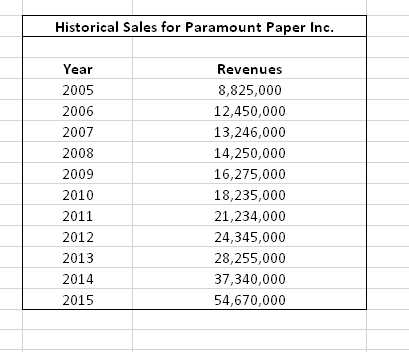
\\begin{tabular}{|l|r|} \\hline \\multicolumn{2}{|c|}{\\( \\begin{array}{c}\\text { Aggregate Income Statement for Paper Industry - } \\\\ \\text { Select } 6 \\text { for Year Ended December 31, 2015 }\\end{array} \\)} \\\\ \\hline & \\\\ Sales Revenues \\\\ Cash Operating Costs & \\( 590,000,000 \\) \\\\ Depreciation & \\( 505,040,000 \\) \\\\ Total Operating Costs & \\( 31,270,000 \\) \\\\ Operating Income (EBIT) & \\( 536,310,000 \\) \\\\ Interest Expenses & \\( 53,690,000 \\) \\\\ Taxable Income & \\( 7,670,000 \\) \\\\ \\hline Taxes & \\( 46,020,000 \\) \\\\ Net Income & \\( 18,408,000 \\) \\\\ \\hline Preferred Dividends & \\( 27,612,000 \\) \\\\ \\hline Addition to Retained Earning & 590,000 \\\\ \\hline \\end{tabular} \\begin{tabular}{|l|r|r|r|} \\hline \\multicolumn{3}{|c|}{ Paramount Paper Inc. } \\\\ & Prior 3-Year Balance Sheets \\\\ \\hline & \\( \\mathbf{2 0 1 3} \\) & \\( \\mathbf{2 0 1 4} \\) & \\( \\mathbf{2 0 1 5} \\) \\\\ \\hline Cash & & & \\\\ \\hline Marketable Securities & 396,000 & 428,000 & 587,000 \\\\ \\hline Accounts Receivables & 460,000 & 540,000 & 638,000 \\\\ \\hline Inventories & \\( 2,225,000 \\) & \\( 2,525,000 \\) & \\( 3,758,000 \\) \\\\ \\hline Current Assets & \\( 3,850,000 \\) & \\( 4,950,000 \\) & \\( 6,013,000 \\) \\\\ \\hline Net Fixed Assets & \\( 6,931,000 \\) & \\( 8,443,000 \\) & \\( 10,996,000 \\) \\\\ \\hline Total Assets & \\( 13,875,000 \\) & \\( 14,576,000 \\) & \\( 17,568,000 \\) \\\\ \\hline & \\( 20,806,000 \\) & \\( 23,019,000 \\) & \\( 28,564,000 \\) \\\\ \\hline Accounts Payables & & & \\\\ \\hline Accruals & 425,000 & 478,000 & 518,000 \\\\ \\hline Notes Payables & 495,000 & 567,000 & 694,000 \\\\ \\hline Current Liabilities & 150,000 & 180,000 & 175,000 \\\\ \\hline Long Term Debt & \\( 1,070,000 \\) & \\( 1,225,000 \\) & \\( 1,387,000 \\) \\\\ \\hline Total Liabilities & \\( 5,250,000 \\) & \\( 6,714,140 \\) & \\( 8,985,980 \\) \\\\ \\hline Preferred Stock & \\( 6,320,000 \\) & \\( 7,939,140 \\) & \\( 10,372,980 \\) \\\\ \\hline Common Stock & \\( 1,550,000 \\) & \\( 1,950,000 \\) & \\( 2,450,000 \\) \\\\ \\hline Retained Earnings & \\( 10,250,000 \\) & \\( 9,500,000 \\) & \\( 10,500,000 \\) \\\\ \\hline Total Owner's Equity & \\( 2,686,000 \\) & \\( 3,629,860 \\) & \\( 5,241,020 \\) \\\\ \\hline Total Liabilities and Owner's Equity & \\( 14,486,000 \\) & \\( 15,079,860 \\) & \\( 18,191,020 \\) \\\\ \\hline ryyy & \\( 20,806,000 \\) & \\( 23,019,000 \\) & \\( 28,564,000 \\) \\\\ \\hline \\end{tabular} \\begin{tabular}{|l|r|} \\hline \\multicolumn{2}{|c|}{\\( \\begin{array}{r}\\text { Aggregate Balance Sheet for Paper Industry - } \\\\ \\text { Select 6 As of December 31, 2015 } \\\\ \\hline\\end{array} \\)} \\\\ \\hline Cash & \\( 6,554,000 \\) \\\\ Marketable Securities & 45,200 \\\\ Accounts Receivables & \\( 32,046,800 \\) \\\\ Inventories & \\( 55,867,200 \\) \\\\ Current Assets & \\( 94,513,200 \\) \\\\ Net Fixed Assets & \\( 131,486,800 \\) \\\\ \\hline Total Assets & \\( 226,000,000 \\) \\\\ \\hline & \\\\ \\hline Accounts Payables & \\( 5,085,000 \\) \\\\ \\hline Accruals & \\( 3,073,600 \\) \\\\ \\hline Notes Payables & \\( 1,898,400 \\) \\\\ \\hline Current Liabilities & \\( 10,057,000 \\) \\\\ \\hline Long Term Debt & \\( 72,885,000 \\) \\\\ \\hline Total Liabilities & \\( 82,942,000 \\) \\\\ \\hline Preferred Stock & \\( 11,752,000 \\) \\\\ \\hline Common Stock & \\( 30,510,000 \\) \\\\ \\hline Retained Earnings & \\( 100,796,000 \\) \\\\ \\hline Total Owner's Equity & \\( 143,058,000 \\) \\\\ \\hline Total Liabilities and Owner's Equity & \\( 226,000,000 \\) \\\\ \\hline \\end{tabular} \\begin{tabular}{|l|r|r|r|} \\hline \\multicolumn{4}{|c|}{ Paramount Paper Inc. } \\\\ \\hline \\multicolumn{3}{|c|}{ Prior 3-Year Income Statements } \\\\ \\hline & \\( \\mathbf{2 0 1 3} \\) & \\( \\mathbf{2 0 1 4} \\) & \\( \\mathbf{2 0 1 5} \\) \\\\ \\hline Sales Revenues & & & \\\\ \\hline Cash Operating Costs & \\( 28,255,000 \\) & \\( 37,340,000 \\) & \\( 54,670,000 \\) \\\\ Depreciation & \\( 22,321,450 \\) & \\( 32,112,400 \\) & \\( 47,562,900 \\) \\\\ Total Operating Costs & \\( 2,775,000 \\) & \\( 2,915,000 \\) & \\( 3,513,000 \\) \\\\ Operating Income (EBIT) & \\( 25,096,450 \\) & \\( 35,027,400 \\) & \\( 51,075,900 \\) \\\\ \\hline Interest Expenses & \\( 3,158,550 \\) & \\( 2,312,600 \\) & \\( 3,594,100 \\) \\\\ Taxable Income & 325,000 & 512,000 & 623,000 \\\\ \\hline Taxes & \\( 2,833,550 \\) & \\( 1,800,600 \\) & \\( 2,971,100 \\) \\\\ Net Income & \\( 1,133,420 \\) & 720,240 & \\( 1,188,440 \\) \\\\ \\hline Preferred Dividends & \\( 1,700,130 \\) & \\( 1,080,360 \\) & \\( 1,782,660 \\) \\\\ \\hline Addition to Retained Earnings & \\( 1,591,630 \\) & 136,500 & 171,500 \\\\ \\hline \\end{tabular} \\begin{tabular}{|c|c|} \\hline \\multicolumn{2}{|c|}{ Historical Sales for Paramount Paper Inc. } \\\\ \\hline & \\\\ \\hline Year & Revenues \\\\ \\hline 2005 & \\( 8,825,000 \\) \\\\ \\hline 2006 & \\( 12,450,000 \\) \\\\ \\hline 2007 & \\( 13,246,000 \\) \\\\ \\hline 2008 & \\( 14,250,000 \\) \\\\ \\hline 2009 & \\( 16,275,000 \\) \\\\ \\hline 2010 & \\( 18,235,000 \\) \\\\ \\hline 2011 & \\( 21,234,000 \\) \\\\ \\hline 2012 & \\( 24,345,000 \\) \\\\ \\hline 2013 & \\( 28,255,000 \\) \\\\ \\hline 2014 & \\( 37,340,000 \\) \\\\ \\hline 2015 & \\( 54,670,000 \\) \\\\ \\hline \\end{tabular} \\begin{tabular}{|l|r|} \\hline \\multicolumn{2}{|c|}{\\( \\begin{array}{c}\\text { Aggregate Income Statement for Paper Industry - } \\\\ \\text { Select } 6 \\text { for Year Ended December 31, 2015 }\\end{array} \\)} \\\\ \\hline & \\\\ Sales Revenues \\\\ Cash Operating Costs & \\( 590,000,000 \\) \\\\ Depreciation & \\( 505,040,000 \\) \\\\ Total Operating Costs & \\( 31,270,000 \\) \\\\ Operating Income (EBIT) & \\( 536,310,000 \\) \\\\ Interest Expenses & \\( 53,690,000 \\) \\\\ Taxable Income & \\( 7,670,000 \\) \\\\ \\hline Taxes & \\( 46,020,000 \\) \\\\ Net Income & \\( 18,408,000 \\) \\\\ \\hline Preferred Dividends & \\( 27,612,000 \\) \\\\ \\hline Addition to Retained Earning & 590,000 \\\\ \\hline \\end{tabular} \\begin{tabular}{|l|r|r|r|} \\hline \\multicolumn{3}{|c|}{ Paramount Paper Inc. } \\\\ & Prior 3-Year Balance Sheets \\\\ \\hline & \\( \\mathbf{2 0 1 3} \\) & \\( \\mathbf{2 0 1 4} \\) & \\( \\mathbf{2 0 1 5} \\) \\\\ \\hline Cash & & & \\\\ \\hline Marketable Securities & 396,000 & 428,000 & 587,000 \\\\ \\hline Accounts Receivables & 460,000 & 540,000 & 638,000 \\\\ \\hline Inventories & \\( 2,225,000 \\) & \\( 2,525,000 \\) & \\( 3,758,000 \\) \\\\ \\hline Current Assets & \\( 3,850,000 \\) & \\( 4,950,000 \\) & \\( 6,013,000 \\) \\\\ \\hline Net Fixed Assets & \\( 6,931,000 \\) & \\( 8,443,000 \\) & \\( 10,996,000 \\) \\\\ \\hline Total Assets & \\( 13,875,000 \\) & \\( 14,576,000 \\) & \\( 17,568,000 \\) \\\\ \\hline & \\( 20,806,000 \\) & \\( 23,019,000 \\) & \\( 28,564,000 \\) \\\\ \\hline Accounts Payables & & & \\\\ \\hline Accruals & 425,000 & 478,000 & 518,000 \\\\ \\hline Notes Payables & 495,000 & 567,000 & 694,000 \\\\ \\hline Current Liabilities & 150,000 & 180,000 & 175,000 \\\\ \\hline Long Term Debt & \\( 1,070,000 \\) & \\( 1,225,000 \\) & \\( 1,387,000 \\) \\\\ \\hline Total Liabilities & \\( 5,250,000 \\) & \\( 6,714,140 \\) & \\( 8,985,980 \\) \\\\ \\hline Preferred Stock & \\( 6,320,000 \\) & \\( 7,939,140 \\) & \\( 10,372,980 \\) \\\\ \\hline Common Stock & \\( 1,550,000 \\) & \\( 1,950,000 \\) & \\( 2,450,000 \\) \\\\ \\hline Retained Earnings & \\( 10,250,000 \\) & \\( 9,500,000 \\) & \\( 10,500,000 \\) \\\\ \\hline Total Owner's Equity & \\( 2,686,000 \\) & \\( 3,629,860 \\) & \\( 5,241,020 \\) \\\\ \\hline Total Liabilities and Owner's Equity & \\( 14,486,000 \\) & \\( 15,079,860 \\) & \\( 18,191,020 \\) \\\\ \\hline ryyy & \\( 20,806,000 \\) & \\( 23,019,000 \\) & \\( 28,564,000 \\) \\\\ \\hline \\end{tabular} \\begin{tabular}{|l|r|} \\hline \\multicolumn{2}{|c|}{\\( \\begin{array}{r}\\text { Aggregate Balance Sheet for Paper Industry - } \\\\ \\text { Select 6 As of December 31, 2015 } \\\\ \\hline\\end{array} \\)} \\\\ \\hline Cash & \\( 6,554,000 \\) \\\\ Marketable Securities & 45,200 \\\\ Accounts Receivables & \\( 32,046,800 \\) \\\\ Inventories & \\( 55,867,200 \\) \\\\ Current Assets & \\( 94,513,200 \\) \\\\ Net Fixed Assets & \\( 131,486,800 \\) \\\\ \\hline Total Assets & \\( 226,000,000 \\) \\\\ \\hline & \\\\ \\hline Accounts Payables & \\( 5,085,000 \\) \\\\ \\hline Accruals & \\( 3,073,600 \\) \\\\ \\hline Notes Payables & \\( 1,898,400 \\) \\\\ \\hline Current Liabilities & \\( 10,057,000 \\) \\\\ \\hline Long Term Debt & \\( 72,885,000 \\) \\\\ \\hline Total Liabilities & \\( 82,942,000 \\) \\\\ \\hline Preferred Stock & \\( 11,752,000 \\) \\\\ \\hline Common Stock & \\( 30,510,000 \\) \\\\ \\hline Retained Earnings & \\( 100,796,000 \\) \\\\ \\hline Total Owner's Equity & \\( 143,058,000 \\) \\\\ \\hline Total Liabilities and Owner's Equity & \\( 226,000,000 \\) \\\\ \\hline \\end{tabular} \\begin{tabular}{|l|r|r|r|} \\hline \\multicolumn{4}{|c|}{ Paramount Paper Inc. } \\\\ \\hline \\multicolumn{3}{|c|}{ Prior 3-Year Income Statements } \\\\ \\hline & \\( \\mathbf{2 0 1 3} \\) & \\( \\mathbf{2 0 1 4} \\) & \\( \\mathbf{2 0 1 5} \\) \\\\ \\hline Sales Revenues & & & \\\\ \\hline Cash Operating Costs & \\( 28,255,000 \\) & \\( 37,340,000 \\) & \\( 54,670,000 \\) \\\\ Depreciation & \\( 22,321,450 \\) & \\( 32,112,400 \\) & \\( 47,562,900 \\) \\\\ Total Operating Costs & \\( 2,775,000 \\) & \\( 2,915,000 \\) & \\( 3,513,000 \\) \\\\ Operating Income (EBIT) & \\( 25,096,450 \\) & \\( 35,027,400 \\) & \\( 51,075,900 \\) \\\\ \\hline Interest Expenses & \\( 3,158,550 \\) & \\( 2,312,600 \\) & \\( 3,594,100 \\) \\\\ Taxable Income & 325,000 & 512,000 & 623,000 \\\\ \\hline Taxes & \\( 2,833,550 \\) & \\( 1,800,600 \\) & \\( 2,971,100 \\) \\\\ Net Income & \\( 1,133,420 \\) & 720,240 & \\( 1,188,440 \\) \\\\ \\hline Preferred Dividends & \\( 1,700,130 \\) & \\( 1,080,360 \\) & \\( 1,782,660 \\) \\\\ \\hline Addition to Retained Earnings & \\( 1,591,630 \\) & 136,500 & 171,500 \\\\ \\hline \\end{tabular} \\begin{tabular}{|c|c|} \\hline \\multicolumn{2}{|c|}{ Historical Sales for Paramount Paper Inc. } \\\\ \\hline & \\\\ \\hline Year & Revenues \\\\ \\hline 2005 & \\( 8,825,000 \\) \\\\ \\hline 2006 & \\( 12,450,000 \\) \\\\ \\hline 2007 & \\( 13,246,000 \\) \\\\ \\hline 2008 & \\( 14,250,000 \\) \\\\ \\hline 2009 & \\( 16,275,000 \\) \\\\ \\hline 2010 & \\( 18,235,000 \\) \\\\ \\hline 2011 & \\( 21,234,000 \\) \\\\ \\hline 2012 & \\( 24,345,000 \\) \\\\ \\hline 2013 & \\( 28,255,000 \\) \\\\ \\hline 2014 & \\( 37,340,000 \\) \\\\ \\hline 2015 & \\( 54,670,000 \\) \\\\ \\hline \\end{tabular}
Step by Step Solution
There are 3 Steps involved in it

Get step-by-step solutions from verified subject matter experts