

Question: 1. Displaying multiple plots in one figure Write a script called PPTask1p1.m to solve the following problem Assume that the complex function f(t) is defined
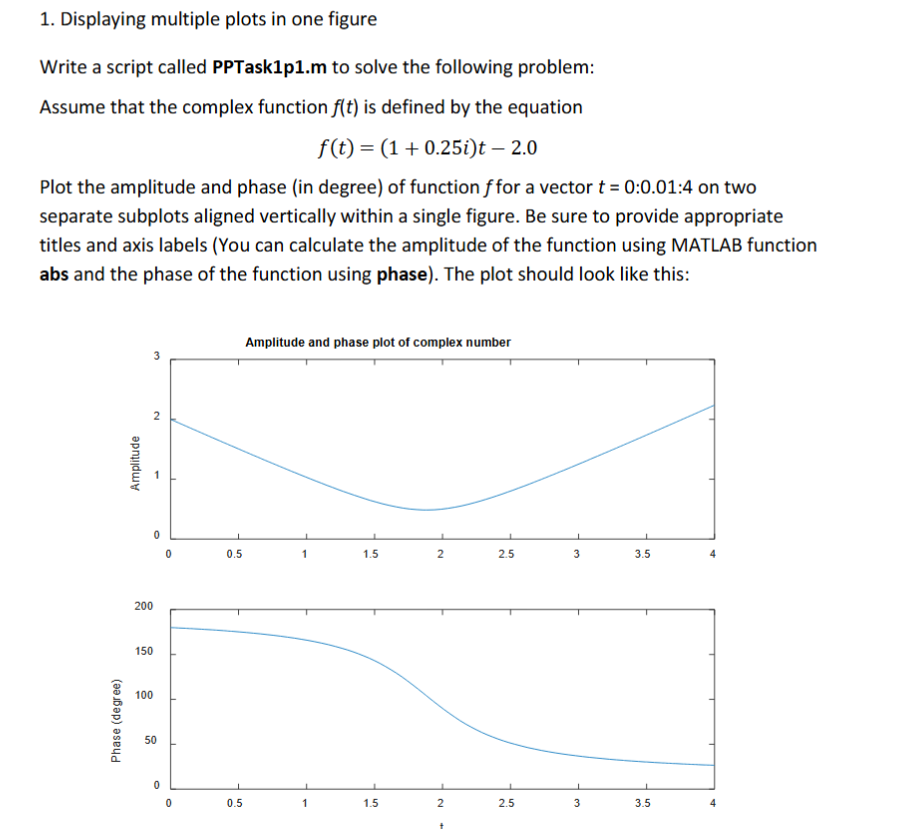
1. Displaying multiple plots in one figure Write a script called PPTask1p1.m to solve the following problem Assume that the complex function f(t) is defined by the equation f(t) (10.25i)t -2.0 Plot the amplitude and phase (in degree) of function ffor a vector t 0:0.01:4 on two separate subplots aligned vertically within a single figure. Be sure to provide appropriate titles and axis labels (You can calculate the amplitude of the function using MATLAB function abs and the phase of the function using phase). The plot should look like this: Amplitude and phase plot of complex number 0.5 1.5 2.5 3.5 200 150 100 50 0.5 2.5 3.5
Step by Step Solution
There are 3 Steps involved in it
1 Expert Approved Answer
Step: 1 Unlock

Question Has Been Solved by an Expert!
Get step-by-step solutions from verified subject matter experts
Step: 2 Unlock
Step: 3 Unlock