

Question: 1. Do in excel and show all steps. explain how to graph Problem 1. You are given the following linear programming problem regarding production of
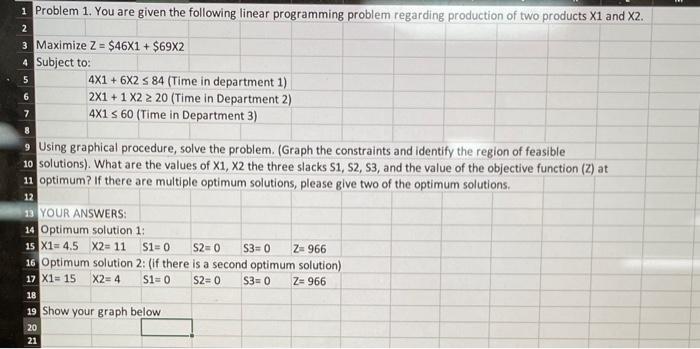
Problem 1. You are given the following linear programming problem regarding production of two products X1 and Xz Maximize Z=$46X1+$692 Subject to: 4X1+6X284(Timeindepartment1)2X1+1220(TimeinDepartment2)4X160(TimeinDepartment3) Using graphical procedure, solve the problem. (Graph the constraints and identify the region of feasible solutions). What are the values of X1,X2 the three slacks S1,S2,S3, and the value of the objective function (Z) at optimum? If there are multiple optimum solutions, please give two of the optimum solutions. YOUR ANSWERS: Optimum solution 1: X1=4.5X2=11S1=0S2=0S3=0Z=966 Optimum solution 2: (if there is a second optimum solution) X1=15X2=4S1=0S2=0S3=0Z=966 Show your graph below
Step by Step Solution
There are 3 Steps involved in it

Get step-by-step solutions from verified subject matter experts