

Question: 1. DO IT !!! Compute for probitability using ROS, ROA, ATO, ROE, EPS for 2019 and 2020 Answer the following questions: In what year is
 1. DO IT !!! Compute for probitability using ROS, ROA, ATO, ROE, EPS for 2019 and 2020
Answer the following questions:
- In what year is the firm more profitable as far as a) operation is concerned, b) use of total assets and c) fair return on shareholders equity?
- Are the assets highly productive?
Answers must be supported by computations for two years 2019-2020. Prepare a a table in comparative format. Use average for assets and total shareholders equity (SHE). Example:
For 2019 (2018 SHE + 2019 SHE then divide by 2). For (2019 SHE + 2020 SHE divided by 2) 2. DO IT !!! Compute for liquidity for 2019 and 2020
Answer the following questions:
- When is the firm more liquid-2019 or 2020?
- When is collection more efficient considering a policy of 60 days to collect?
- When are the inventories disposed off faster- 2019 or 2020?
3. DO IT !!! Compute for solvency for 2019 and 2020
Answer the following questions:
- Is the company highly financed by borrowed debts(this is called financial leverage?
- Is the profit adequate to meet interest payments?
- Compare ROE against the Interest rate, is borrowing a risky proposition for the company?
Please kindly follow the instructions, show your solution, answer each and every question! Thank you!
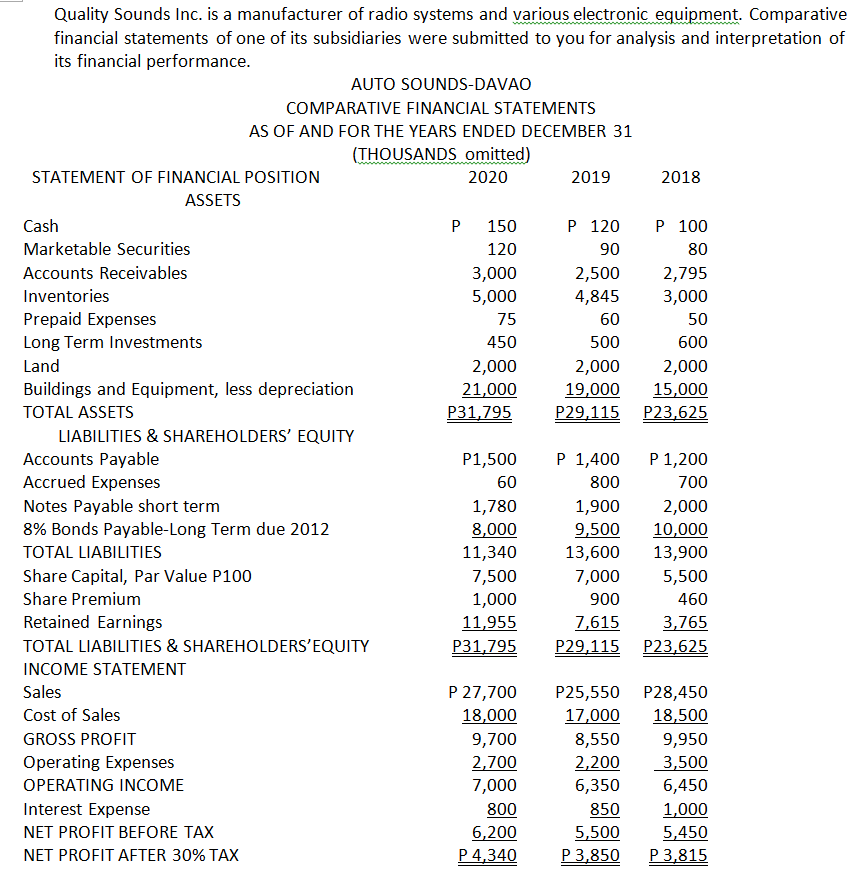
75 Quality Sounds Inc. is a manufacturer of radio systems and various electronic equipment. Comparative financial statements of one of its subsidiaries were submitted to you for analysis and interpretation of its financial performance. AUTO SOUNDS-DAVAO COMPARATIVE FINANCIAL STATEMENTS AS OF AND FOR THE YEARS ENDED DECEMBER 31 (THOUSANDS omitted) STATEMENT OF FINANCIAL POSITION 2020 2019 2018 ASSETS Cash 150 P 120 P 100 Marketable Securities 120 90 80 Accounts Receivables 3,000 2,500 2,795 Inventories 5,000 4,845 3,000 Prepaid Expenses 60 50 Long Term Investments 450 500 600 Land 2,000 2,000 2,000 Buildings and Equipment, less depreciation 21,000 19,000 15,000 TOTAL ASSETS P31,795 P29.115 P23,625 LIABILITIES & SHAREHOLDERS' EQUITY Accounts Payable P1,500 P 1,400 P 1,200 Accrued Expenses 60 800 700 Notes Payable short term 1,780 1,900 2,000 8% Bonds Payable-Long Term due 2012 8,000 9,500 10,000 TOTAL LIABILITIES 11,340 13,600 13,900 Share Capital, Par Value P100 7,500 7,000 5,500 Share Premium 1,000 900 460 Retained Earnings 11,955 7,615 3,765 TOTAL LIABILITIES & SHAREHOLDERS'EQUITY P31,795 P29,115 P23,625 INCOME STATEMENT Sales P 27,700 P25,550 P28,450 Cost of Sales 18,000 17,000 18,500 GROSS PROFIT 9,700 8,550 9,950 Operating Expenses 2,700 2,200 3,500 OPERATING INCOME 7,000 6,350 6,450 Interest Expense 800 850 1,000 NET PROFIT BEFORE TAX 6,200 5,500 5,450 NET PROFIT AFTER 30% TAX P 4,340 P 3,850 P 3,815 75 Quality Sounds Inc. is a manufacturer of radio systems and various electronic equipment. Comparative financial statements of one of its subsidiaries were submitted to you for analysis and interpretation of its financial performance. AUTO SOUNDS-DAVAO COMPARATIVE FINANCIAL STATEMENTS AS OF AND FOR THE YEARS ENDED DECEMBER 31 (THOUSANDS omitted) STATEMENT OF FINANCIAL POSITION 2020 2019 2018 ASSETS Cash 150 P 120 P 100 Marketable Securities 120 90 80 Accounts Receivables 3,000 2,500 2,795 Inventories 5,000 4,845 3,000 Prepaid Expenses 60 50 Long Term Investments 450 500 600 Land 2,000 2,000 2,000 Buildings and Equipment, less depreciation 21,000 19,000 15,000 TOTAL ASSETS P31,795 P29.115 P23,625 LIABILITIES & SHAREHOLDERS' EQUITY Accounts Payable P1,500 P 1,400 P 1,200 Accrued Expenses 60 800 700 Notes Payable short term 1,780 1,900 2,000 8% Bonds Payable-Long Term due 2012 8,000 9,500 10,000 TOTAL LIABILITIES 11,340 13,600 13,900 Share Capital, Par Value P100 7,500 7,000 5,500 Share Premium 1,000 900 460 Retained Earnings 11,955 7,615 3,765 TOTAL LIABILITIES & SHAREHOLDERS'EQUITY P31,795 P29,115 P23,625 INCOME STATEMENT Sales P 27,700 P25,550 P28,450 Cost of Sales 18,000 17,000 18,500 GROSS PROFIT 9,700 8,550 9,950 Operating Expenses 2,700 2,200 3,500 OPERATING INCOME 7,000 6,350 6,450 Interest Expense 800 850 1,000 NET PROFIT BEFORE TAX 6,200 5,500 5,450 NET PROFIT AFTER 30% TAX P 4,340 P 3,850 P 3,815
Step by Step Solution
There are 3 Steps involved in it

Get step-by-step solutions from verified subject matter experts