

Question: 1. Draw 2 histograms by hand or using software. In the first histogram show the distribution of CBD per cartridge for the north process. In
1. Draw 2 histograms by hand or using software. In the first histogram show the distribution of CBD per cartridge for the north process. In the second histogram show the corresponding distribution for the south one. Use the same vertical and horizontal scales for both diagrams. You might need to try different bin limits to see what works best for the horizontal scale. In about 2 sentences, describe the main similarities or differences you can see in the 2 histograms.
2. Perform a statistical test to compare the width or spread of the 2 distributions. That is, do a 2-sample F-test to compare the variance of the north process to that of the south one. Make sure the F-calculated value is greater than 1. You can perform this test using software or by hand. For hand calculations you can use the Excel functions finv() or f.inv() to get the critical value and fdist() or 1-f.dist() to get the significance p. In about 1-2 sentences, briefly describe what the test indicates.
3. Perform 3 statistical tests of means as follows. After each one, briefly describe what the test indicates in about 1-2 sentences.
(a) First do a 2-sample t-test to compare the mean of the north process to the mean of the south one, assuming unequal variances. Use software for this calculation.
(b) Second, do a 1-sample t-test to compare the mean of the north process to the design target for the product. Do this calculation by hand. You can use the Excel functions tinv() or t.inv.2t() to get the critical value and tdist() or t.dist.2t() to get the p.
(c) Third, do a similar 1-sample t-test by hand to compare the south process mean to the design target value.
4. Given the results above, how do products from the north process compare to those from the south process? Your answer should take about 2-4 sentences.
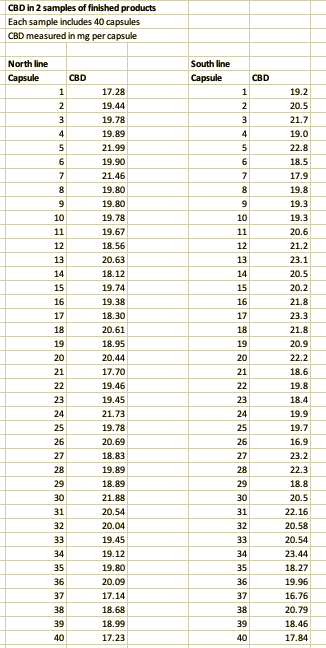
CBD in 2 samples of finished products Each sample includes 40 capsules CBD measured in mg per capsule North line Capsule South line Capsule CBD 1 CBD 1 2 3 2 3 4 4 5 5 6 6 7 7 8 9 10 11 12 13 14 15 16 17 8 9 10 11 12 13 14 15 16 17 18 19 20 21 22 23 24 25 26 27 18 17.28 19.44 19.78 19.89 21.99 19.90 21.46 19.80 19.80 19.78 19.67 18.56 20.63 18.12 19.74 19.38 18.30 20.61 18.95 20.44 17.70 19.46 19.45 21.73 19.78 20.69 18.83 19.89 18.89 21.88 20.54 20.04 19.45 19.12 19.80 20.09 17.14 18.68 18.99 17.23 19 20 19.2 20.5 21.7 19.0 22.8 18.5 17.9 19.8 19.3 19.3 20.6 21.2 23.1 20.5 20.2 21.8 23.3 21.8 20.9 22.2 18.6 19.8 18.4 19.9 19.7 16.9 23.2 22.3 18.8 20.5 22.16 20.58 20.54 23.44 18.27 19.96 16.76 20.79 18.46 17.84 21 22 28 29 23 24 25 26 27 28 29 30 31 32 33 34 35 36 37 38 39 40 30 31 32 33 34 35 36 37 38 39 40 CBD in 2 samples of finished products Each sample includes 40 capsules CBD measured in mg per capsule North line Capsule South line Capsule CBD 1 CBD 1 2 3 2 3 4 4 5 5 6 6 7 7 8 9 10 11 12 13 14 15 16 17 8 9 10 11 12 13 14 15 16 17 18 19 20 21 22 23 24 25 26 27 18 17.28 19.44 19.78 19.89 21.99 19.90 21.46 19.80 19.80 19.78 19.67 18.56 20.63 18.12 19.74 19.38 18.30 20.61 18.95 20.44 17.70 19.46 19.45 21.73 19.78 20.69 18.83 19.89 18.89 21.88 20.54 20.04 19.45 19.12 19.80 20.09 17.14 18.68 18.99 17.23 19 20 19.2 20.5 21.7 19.0 22.8 18.5 17.9 19.8 19.3 19.3 20.6 21.2 23.1 20.5 20.2 21.8 23.3 21.8 20.9 22.2 18.6 19.8 18.4 19.9 19.7 16.9 23.2 22.3 18.8 20.5 22.16 20.58 20.54 23.44 18.27 19.96 16.76 20.79 18.46 17.84 21 22 28 29 23 24 25 26 27 28 29 30 31 32 33 34 35 36 37 38 39 40 30 31 32 33 34 35 36 37 38 39 40
Step by Step Solution
There are 3 Steps involved in it

Get step-by-step solutions from verified subject matter experts