

Question: 1. Draw a Frequency Table: Given: (Grouped Data) Men and Women Age Frequency 2-10 5 11-19 8 20-28 10 29-37 12 38-46 13 47-55 15

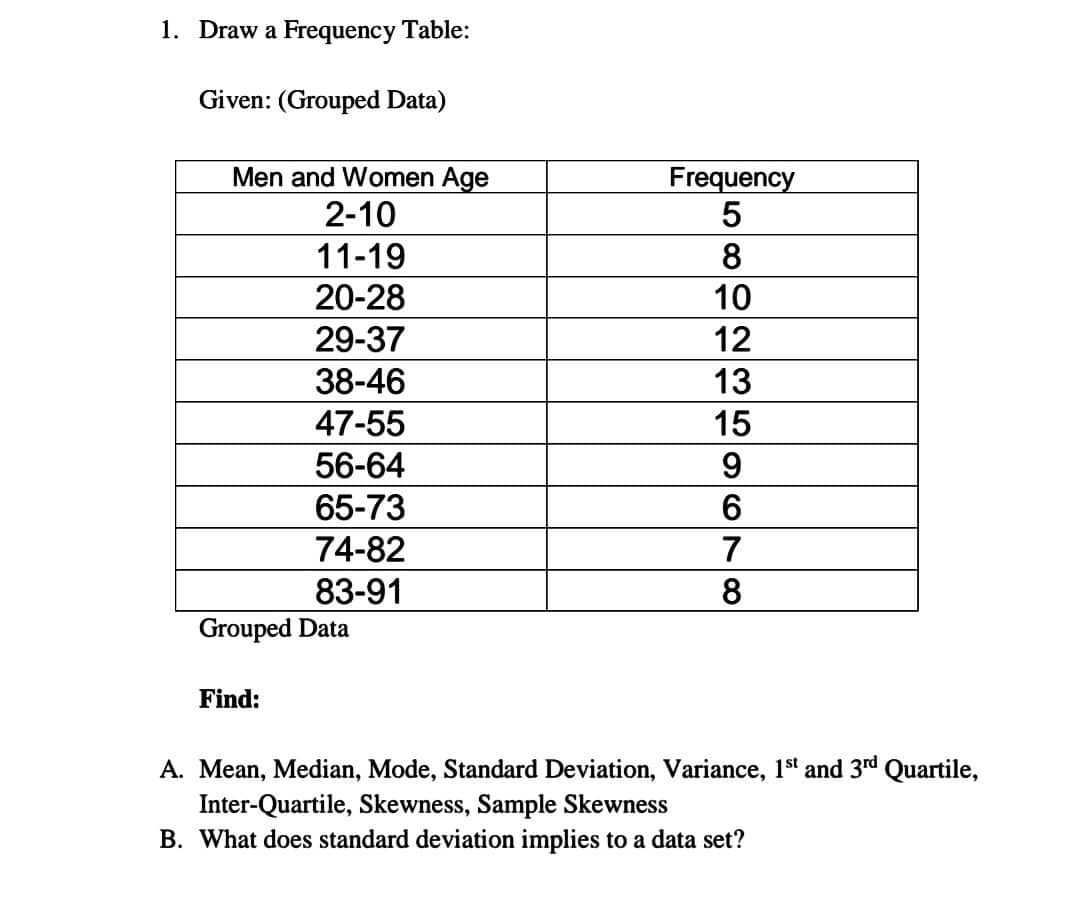
1. Draw a Frequency Table: Given: (Grouped Data) Men and Women Age Frequency 2-10 5 11-19 8 20-28 10 29-37 12 38-46 13 47-55 15 56-64 CO 65-73 6 74-82 83-91 8 Grouped Data Find: A. Mean, Median, Mode, Standard Deviation, Variance, 15t and 3"d Quartile, Inter-Quartile, Skewness, Sample Skewness B. What does standard deviation implies to a data set
Step by Step Solution
There are 3 Steps involved in it
1 Expert Approved Answer
Step: 1 Unlock

Question Has Been Solved by an Expert!
Get step-by-step solutions from verified subject matter experts
Step: 2 Unlock
Step: 3 Unlock