

Question: 1. Enter the data from this table into the TI-83+ or desmos and make a scatter plot. Copy the image of your graph into your
1. Enter the data from this table into the TI-83+ or desmos and make a scatter plot. Copy the image of your graph into your assignment.
2. Describe the relationship of the graph. Remember to comment on the nature of the relationship, strength, direction, and if there are any outliers.
3. Calculate the average rate of change from 0.5 carats to 0.7 carats. Explain the meaning of the result.
4. Estimate the cost of a diamond of this quality with a size of 8 carats.
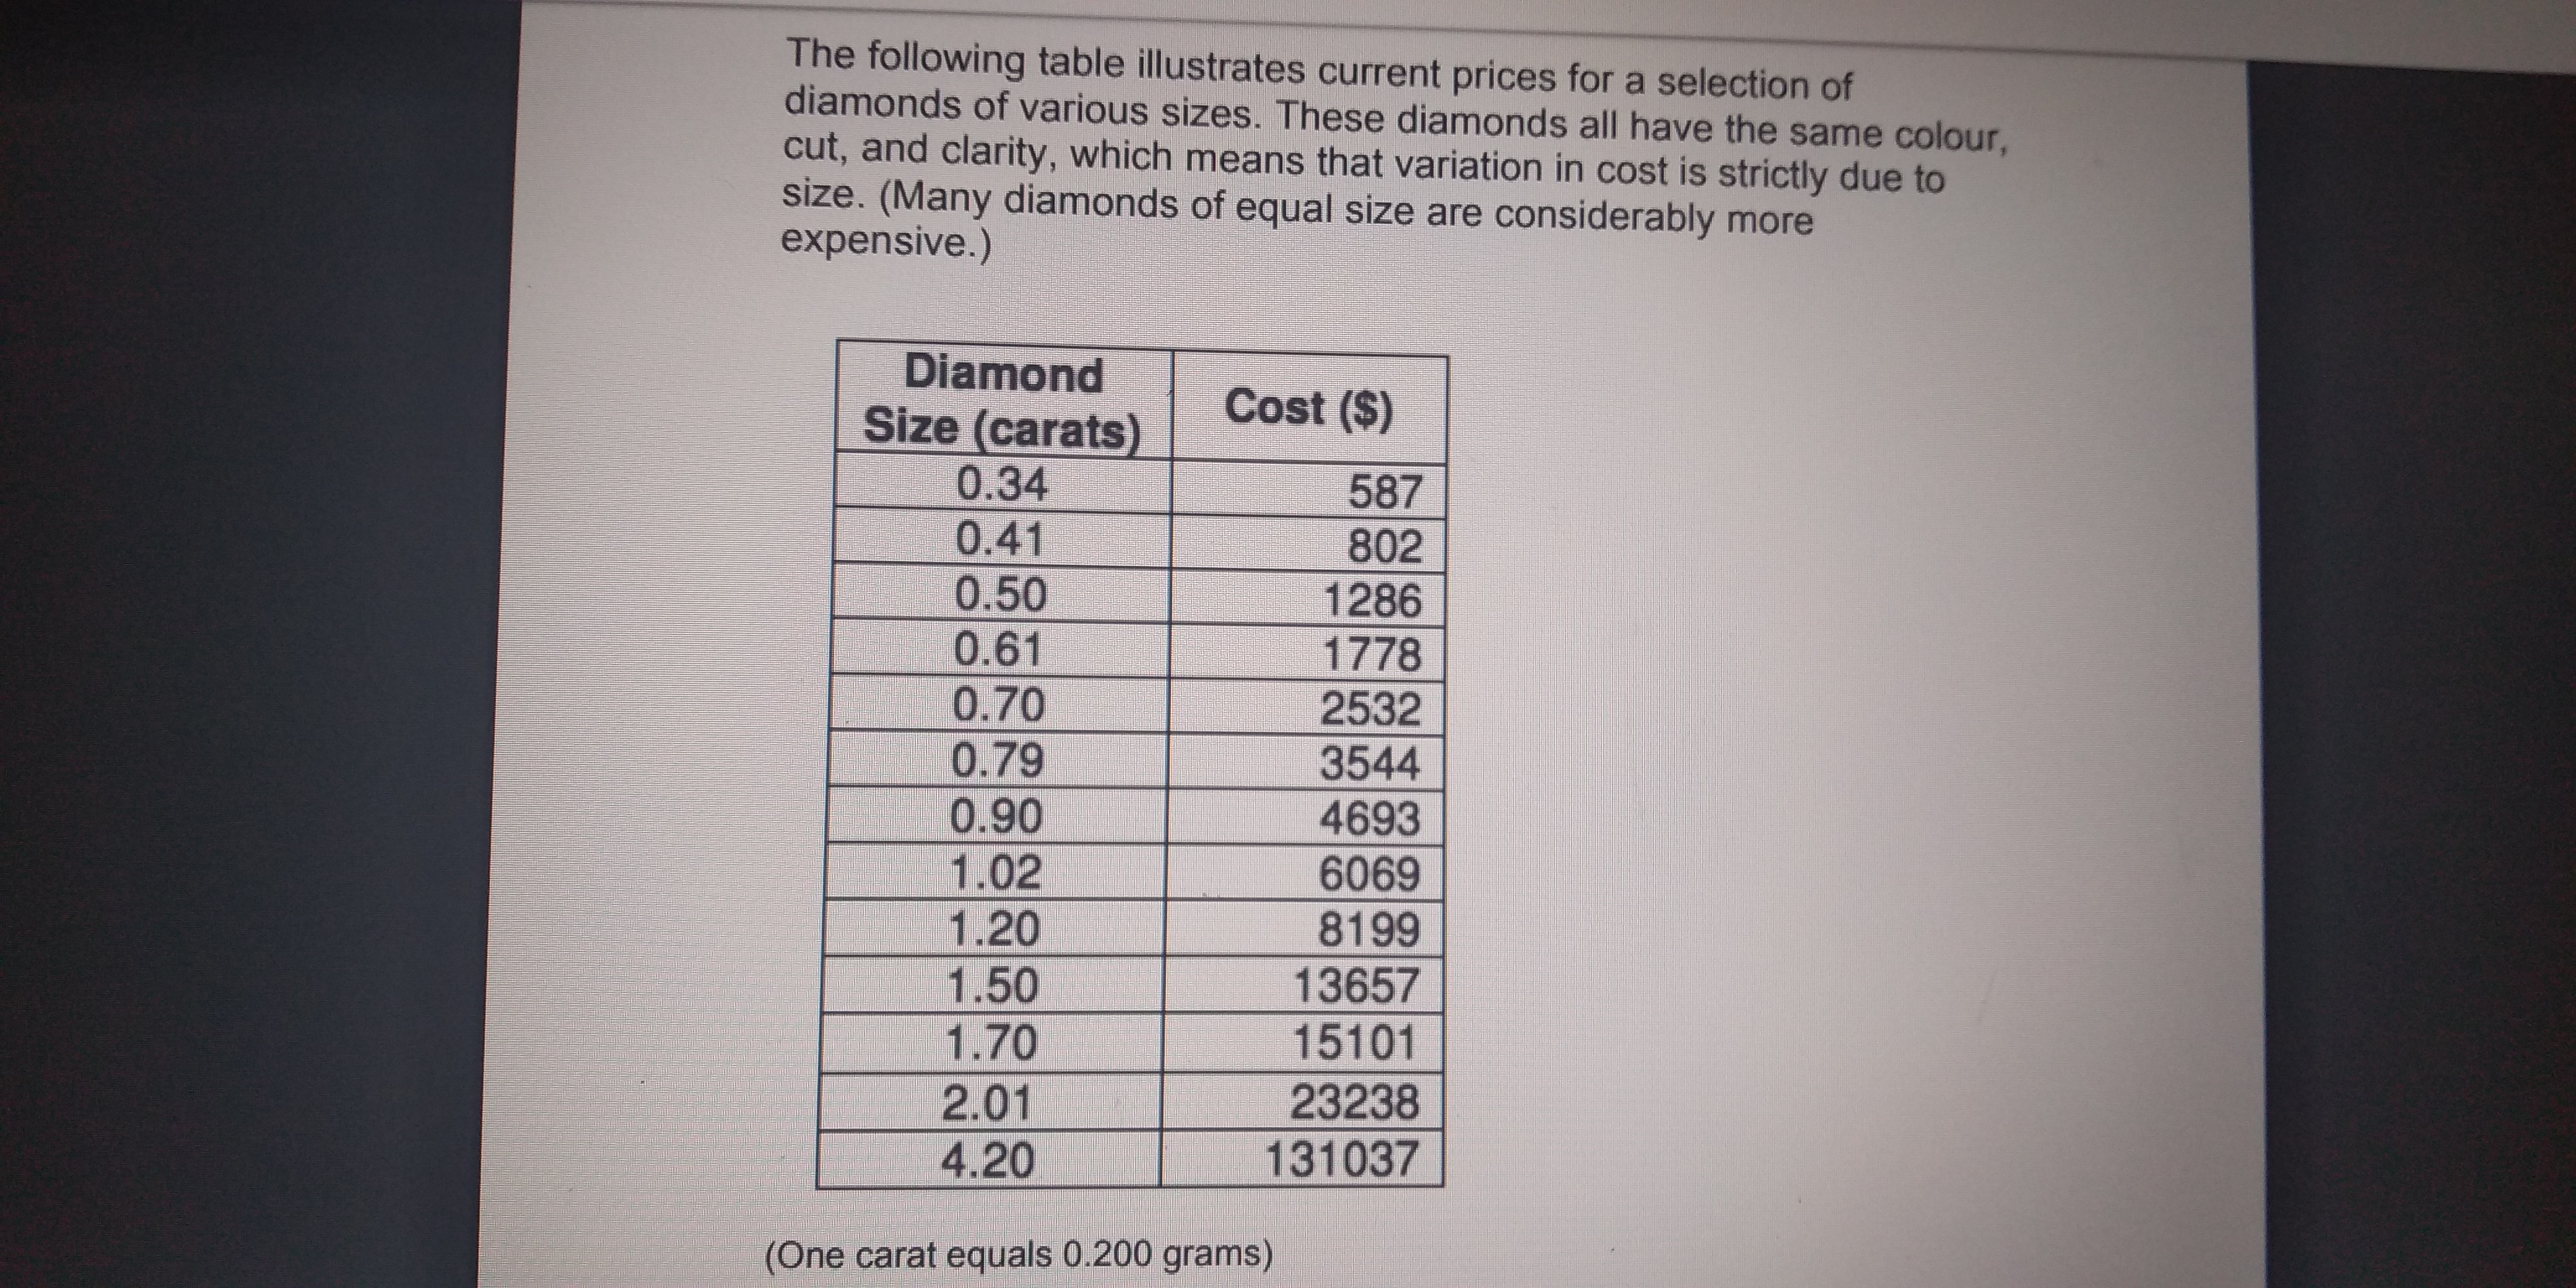
The following table illustrates current prices for a selection of diamonds of various sizes. These diamonds all have the same colour, cut, and clarity, which means that variation in cost is strictly due to size. (Many diamonds of equal size are considerably more expensive.) Diamond Size (carats) Cost ($) 0.34 587 0.41 802 0.50 1286 0.61 1778 0.70 2532 0.79 3544 0.90 4693 1.02 6069 1.20 8199 1.50 13657 1.70 15101 2.01 23238 4.20 131037 (One carat equals 0.200 grams)
Step by Step Solution
There are 3 Steps involved in it

Get step-by-step solutions from verified subject matter experts