

Question: 1. Enter the Month data into column A on the spreadsheet and the Length ofDoylight data into column B on the spreadsheet. 2. Using your
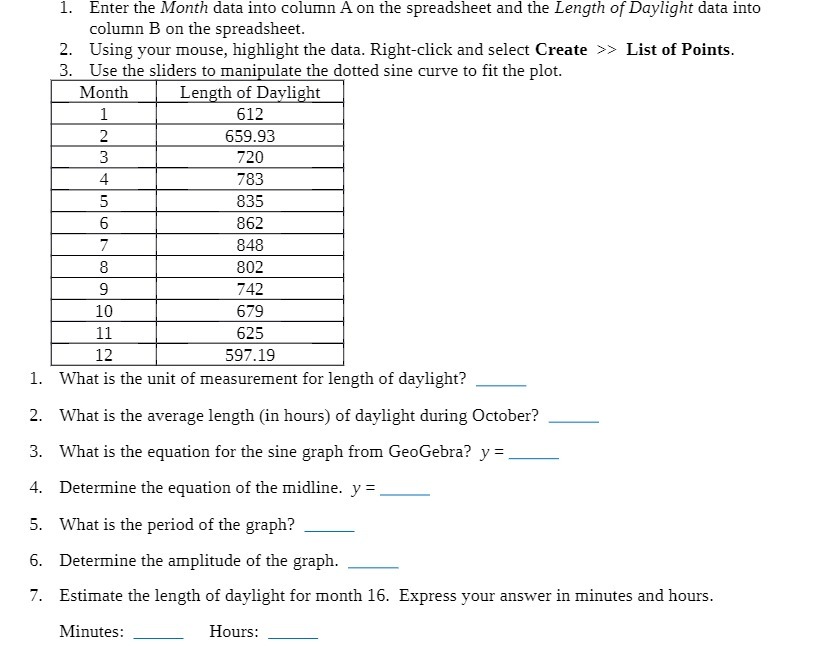
1. Enter the Month data into column A on the spreadsheet and the Length ofDoylight data into column B on the spreadsheet. 2. Using your mouse, highlight the data. Rightclick and select Create >> List of Points. 3. Use the sliders to maniuulate the dotted sine curve to t the plot. 1. What is the unit of measurement for length of daylight? 2. What is the average length [in hours) of daylight during October? 3. What is the equation for the sine graph from GeoGehra? y = 4. Determine the equation of the midline. y = 5. What is the period of the graph? 6. Determine the amplitude of the graph. 7'. Estimate the length of daylight for month 16. Express your answer in minutes and hours. Minutes: Hours
Step by Step Solution
There are 3 Steps involved in it

Get step-by-step solutions from verified subject matter experts