

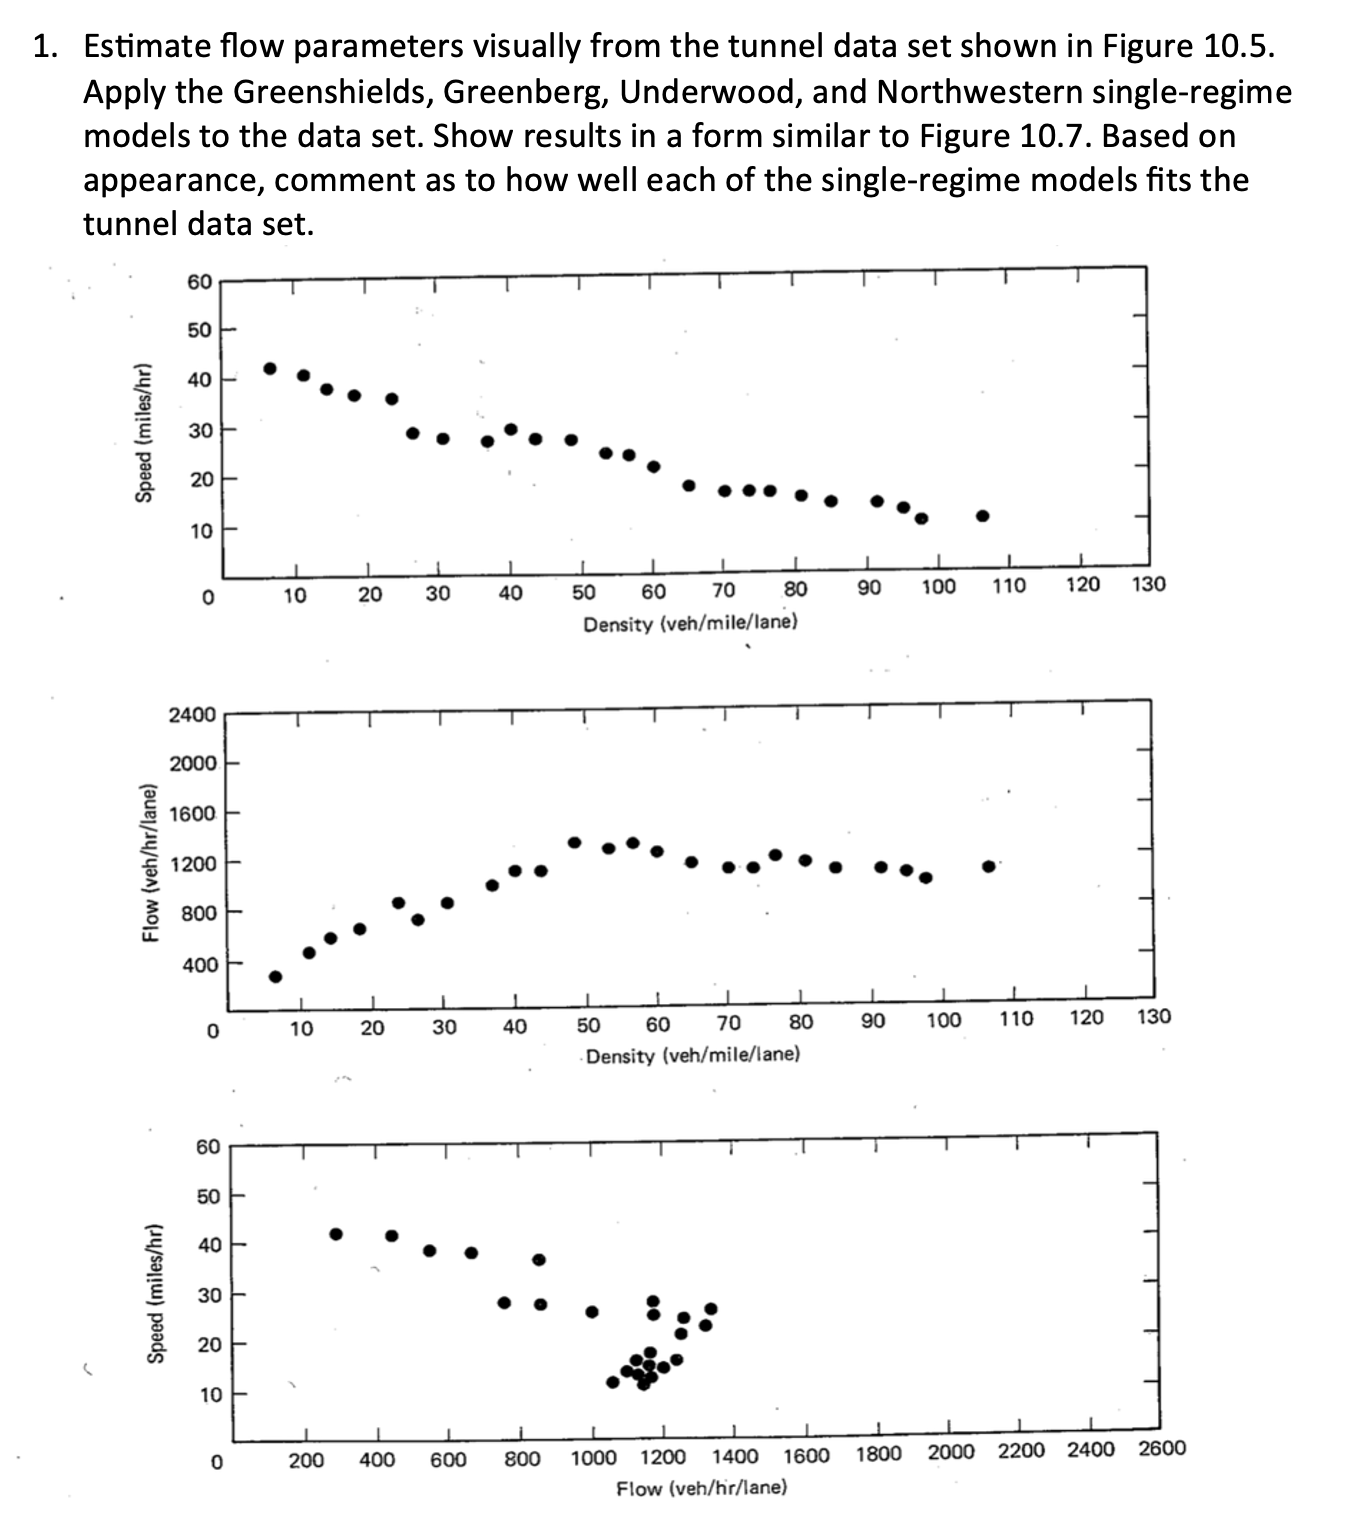
Question: 1 . Estimate flow parameters visually from the tunnel data set shown in Figure 1 0 . 5 . Apply the Greenshields, Greenberg, Underwood, and
Estimate flow parameters visually from the tunnel data set shown in Figure Apply the Greenshields, Greenberg, Underwood, and Northwestern singleregime models to the data set. Show results in a form similar to Figure Based on appearance, comment as to how well each of the singleregime models fits the tunnel data set.
Step by Step Solution
There are 3 Steps involved in it
1 Expert Approved Answer
Step: 1 Unlock

Question Has Been Solved by an Expert!
Get step-by-step solutions from verified subject matter experts
Step: 2 Unlock
Step: 3 Unlock